23 Upton St Peabody, MA 01960
Peabody Town Center NeighborhoodEstimated Value: $2,495,375
Studio
--
Bath
27,337
Sq Ft
$91/Sq Ft
Est. Value
About This Home
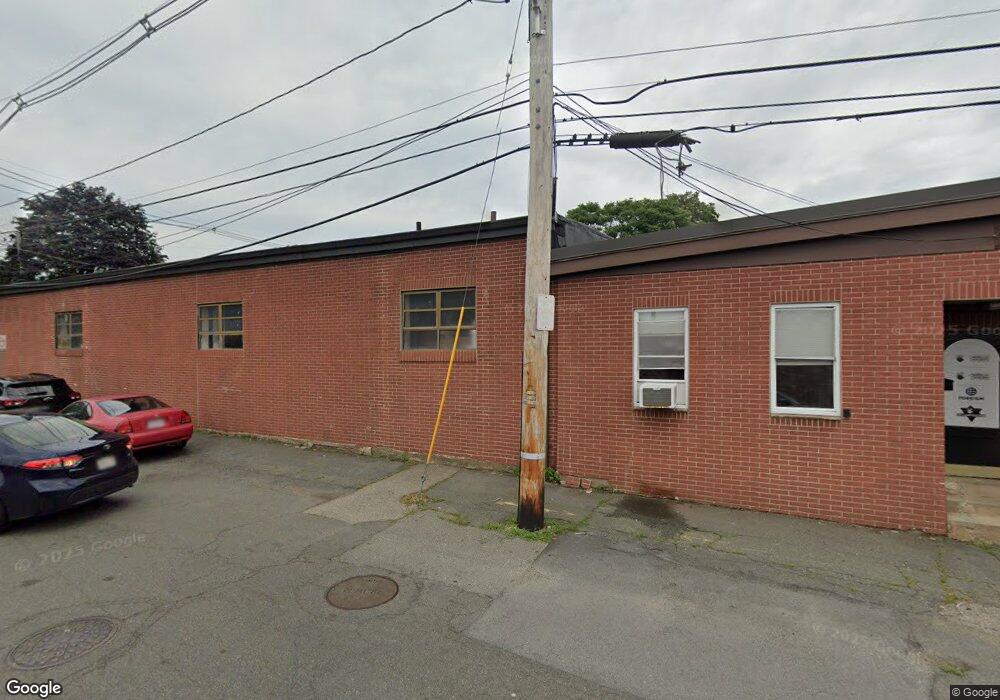
This home is located at 23 Upton St, Peabody, MA 01960 and is currently estimated at $2,495,375, approximately $91 per square foot. 23 Upton St is a home located in Essex County with nearby schools including Peabody Veterans Memorial High School, St John The Baptist School, and The Phoenix School.
Ownership History
Date
Name
Owned For
Owner Type
Purchase Details
Closed on
Jan 28, 2010
Sold by
Commercial Dehumidific
Bought by
Allstar Collision Rt and Cucurull
Current Estimated Value
Create a Home Valuation Report for This Property
The Home Valuation Report is an in-depth analysis detailing your home's value as well as a comparison with similar homes in the area
Home Values in the Area
Average Home Value in this Area
Purchase History
We collect this data history from publicly available records. To have your information removed, we recommend requesting removal directly through your county’s website.
| Date | Buyer | Sale Price | Title Company |
|---|---|---|---|
| Allstar Collision Rt | $875,000 | -- |
Source: Public Records
Mortgage History
We collect this data history from publicly available records. To have your information removed, we recommend requesting removal directly through your county’s website.
| Date | Status | Borrower | Loan Amount |
|---|---|---|---|
| Open | Allstar Collision Rt | $878,100 | |
| Closed | Allstar Collision Rt | $172,500 | |
| Closed | Allstar Collision Rt | $172,500 |
Source: Public Records
Tax History
| Year | Tax Paid | Tax Assessment Tax Assessment Total Assessment is a certain percentage of the fair market value that is determined by local assessors to be the total taxable value of land and additions on the property. | Land | Improvement |
|---|---|---|---|---|
| 2025 | $43,162 | $2,269,300 | $643,800 | $1,625,500 |
| 2024 | $39,052 | $2,073,900 | $585,200 | $1,488,700 |
| 2023 | $37,558 | $1,909,400 | $487,800 | $1,421,600 |
| 2022 | $36,266 | $1,715,500 | $399,600 | $1,315,900 |
| 2021 | $32,379 | $1,458,500 | $399,600 | $1,058,900 |
| 2020 | $26,802 | $1,170,900 | $399,600 | $771,300 |
| 2019 | $27,739 | $1,170,900 | $399,600 | $771,300 |
| 2018 | $23,531 | $976,000 | $380,400 | $595,600 |
| 2017 | $22,806 | $938,900 | $380,400 | $558,500 |
| 2016 | $22,712 | $938,900 | $380,400 | $558,500 |
| 2015 | $22,060 | $907,800 | $325,000 | $582,800 |
Source: Public Records
Map
Nearby Homes
- 6 Munroe St
- 46 Walnut St
- 16 Tremont St
- 24 Tracey St
- 41 Northend St
- 64 Foster St Unit 403
- 10 Crowninshield St Unit 106
- 80 Foster St Unit 504
- 8 Sparrow Ln
- 112 Lowell St Unit 11
- 13 Kirkland Rd
- 111 Foster St Unit 315
- 111 Foster St Unit 416
- 149 Washington St
- 3 Southwick Rd
- 65 Ord St
- 38-1/2 Ellsworth Rd
- 18 Balcomb St Unit B
- 18 Balcomb St
- 16 Thorndike St
Your Personal Tour Guide
Ask me questions while you tour the home.