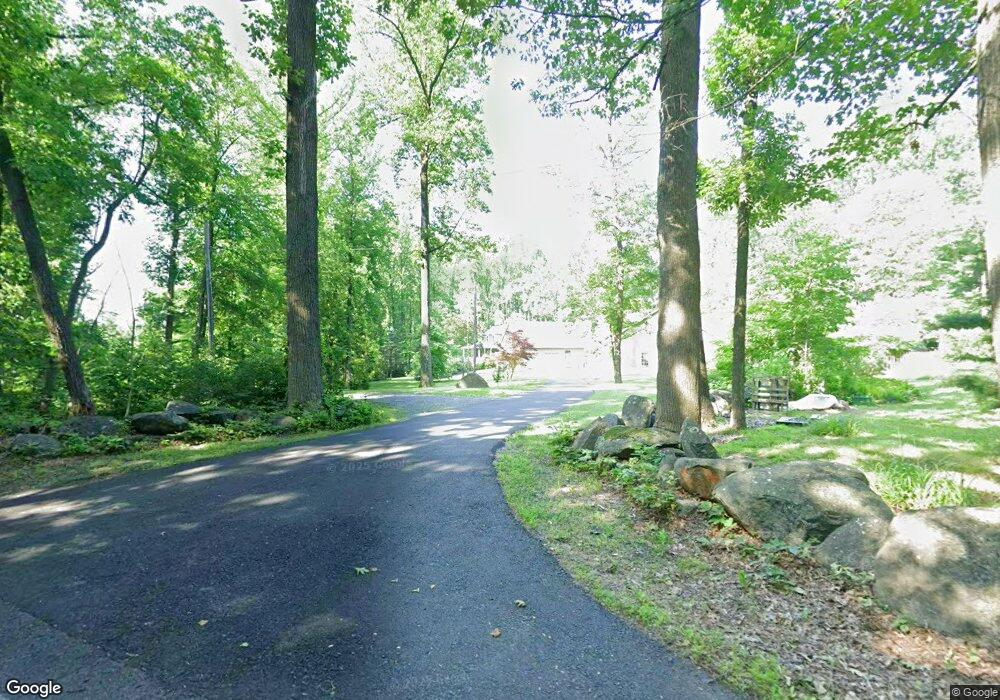
230 E Cherry Rd Quakertown, PA 18951
Richland NeighborhoodEstimated Value: $524,000 - $559,087
3
Beds
3
Baths
2,082
Sq Ft
$259/Sq Ft
Est. Value
About This Home
This home is located at 230 E Cherry Rd, Quakertown, PA 18951 and is currently estimated at $539,522, approximately $259 per square foot. 230 E Cherry Rd is a home with nearby schools including Neidig Elementary School, Strayer Middle School, and Quakertown Community Senior High School.
Ownership History
Date
Name
Owned For
Owner Type
Purchase Details
Closed on
Mar 18, 2020
Sold by
Bolger Charles F
Bought by
Wich Kurt Patrick and Wich Dena C
Current Estimated Value
Purchase Details
Closed on
Nov 8, 2005
Sold by
Siek Patsy Bolger
Bought by
Bolger Charles F
Purchase Details
Closed on
Aug 22, 1986
Bought by
Bolger Charles F and Bolger Anna M
Create a Home Valuation Report for This Property
The Home Valuation Report is an in-depth analysis detailing your home's value as well as a comparison with similar homes in the area
Home Values in the Area
Average Home Value in this Area
Purchase History
| Date | Buyer | Sale Price | Title Company |
|---|---|---|---|
| Wich Kurt Patrick | -- | Laurel Abstract Company | |
| Bolger Charles F | $65,000 | None Available | |
| Bolger Charles F | -- | -- |
Source: Public Records
Tax History
| Year | Tax Paid | Tax Assessment Tax Assessment Total Assessment is a certain percentage of the fair market value that is determined by local assessors to be the total taxable value of land and additions on the property. | Land | Improvement |
|---|---|---|---|---|
| 2025 | $7,160 | $33,580 | $3,540 | $30,040 |
| 2024 | $7,160 | $33,580 | $3,540 | $30,040 |
| 2023 | $7,017 | $33,580 | $3,540 | $30,040 |
| 2022 | $625 | $3,040 | $3,040 | $0 |
| 2021 | $625 | $3,040 | $3,040 | $0 |
| 2020 | $625 | $3,040 | $3,040 | $0 |
| 2019 | $608 | $3,040 | $3,040 | $0 |
| 2018 | $588 | $3,040 | $3,040 | $0 |
| 2017 | $571 | $3,040 | $3,040 | $0 |
| 2016 | $571 | $3,040 | $3,040 | $0 |
| 2015 | -- | $3,040 | $3,040 | $0 |
| 2014 | -- | $3,040 | $3,040 | $0 |
Source: Public Records
Map
Nearby Homes
Your Personal Tour Guide
Ask me questions while you tour the home.