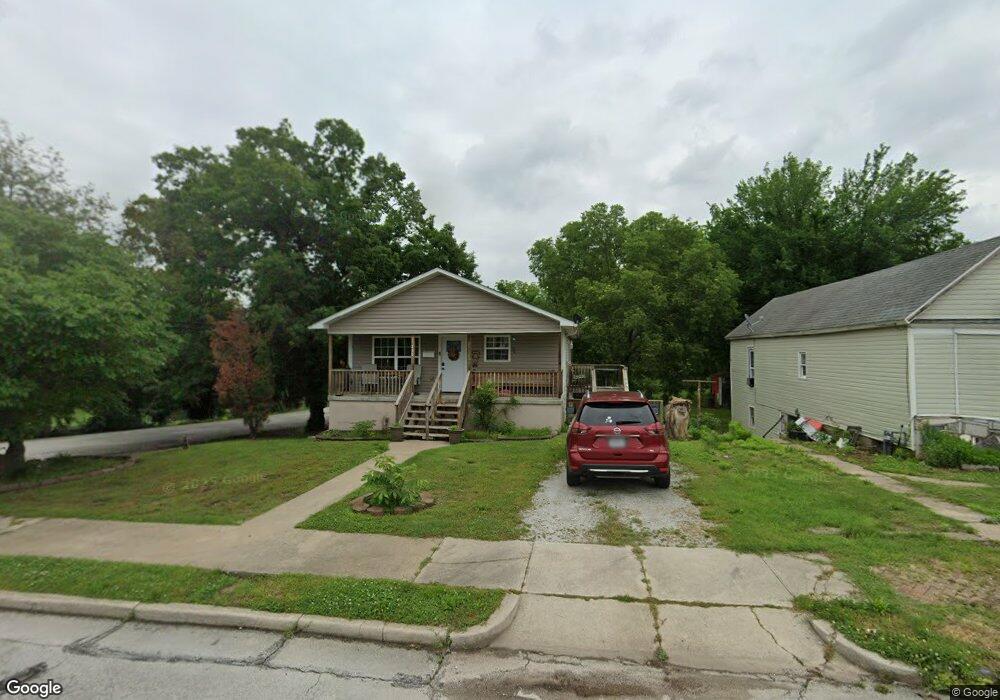
230 N Maple St Carthage, MO 64836
Estimated Value: $189,000 - $259,000
Studio
2
Baths
1,248
Sq Ft
$175/Sq Ft
Est. Value
About This Home
This home is located at 230 N Maple St, Carthage, MO 64836 and is currently estimated at $217,909, approximately $174 per square foot. 230 N Maple St is a home located in Jasper County with nearby schools including Carthage High School, Victory Academy, and St. Ann's Catholic School.
Ownership History
Date
Name
Owned For
Owner Type
Purchase Details
Closed on
Jun 21, 2021
Sold by
Leece Anthony W and Leece Loretta
Bought by
Leece Anthony W and Leece Loretta
Current Estimated Value
Purchase Details
Closed on
Jun 17, 2021
Sold by
Leece Anthony W and Leece Loretta
Bought by
Martin Josh A
Purchase Details
Closed on
Sep 24, 2009
Sold by
Joplin Area Habitat For Humanity Inc
Bought by
Byrd Loretta
Home Financials for this Owner
Home Financials are based on the most recent Mortgage that was taken out on this home.
Original Mortgage
$72,500
Interest Rate
5.36%
Mortgage Type
Stand Alone First
Purchase Details
Closed on
Nov 3, 2005
Sold by
Holt Stephen H
Bought by
Cornerstone Holdings Llc
Create a Home Valuation Report for This Property
The Home Valuation Report is an in-depth analysis detailing your home's value as well as a comparison with similar homes in the area
Home Values in the Area
Average Home Value in this Area
Purchase History
| Date | Buyer | Sale Price | Title Company |
|---|---|---|---|
| Leece Anthony W | -- | None Listed On Document | |
| Martin Josh A | -- | None Available | |
| Leece Anthony W | -- | None Listed On Document | |
| Byrd Loretta | -- | Jct | |
| Cornerstone Holdings Llc | $800 | -- |
Source: Public Records
Mortgage History
| Date | Status | Borrower | Loan Amount |
|---|---|---|---|
| Previous Owner | Byrd Loretta | $72,500 |
Source: Public Records
Tax History
| Year | Tax Paid | Tax Assessment Tax Assessment Total Assessment is a certain percentage of the fair market value that is determined by local assessors to be the total taxable value of land and additions on the property. | Land | Improvement |
|---|---|---|---|---|
| 2025 | $1,139 | $25,270 | $570 | $24,700 |
| 2024 | $1,139 | $22,120 | $570 | $21,550 |
| 2023 | $1,139 | $22,120 | $570 | $21,550 |
| 2022 | $1,131 | $22,040 | $570 | $21,470 |
| 2021 | $1,119 | $22,040 | $570 | $21,470 |
| 2020 | $1,025 | $19,350 | $570 | $18,780 |
| 2019 | $1,026 | $19,350 | $570 | $18,780 |
| 2018 | $1,046 | $19,770 | $0 | $0 |
| 2017 | $1,049 | $19,770 | $0 | $0 |
| 2016 | $1,089 | $20,590 | $0 | $0 |
| 2015 | $1,006 | $20,590 | $0 | $0 |
| 2014 | $1,006 | $20,590 | $0 | $0 |
Source: Public Records
Map
Nearby Homes
- 910 W Vine St
- 802 Oak St
- 705 S Fulton St
- 1014 S Main St
- 909 S Fulton St
- 827 W Chestnut St
- 1101 Oak St
- 1135 S Maple St
- 1133 S Main St
- 1135 Lyon St
- 1105 Walnut St
- 1144 S Main St
- 1160 S Maple St
- 1112 S Garrison Ave
- 510 Miller St
- 1324 W Central Ave
- 522 E Macon St
- 1213 Kellar St
- 1242 S Garrison Ave
- 828 W Macon St
Your Personal Tour Guide
Ask me questions while you tour the home.