230 Salisbury St Worcester, MA 01609
Indian Lake East NeighborhoodEstimated Value: $761,000 - $958,000
About This Home
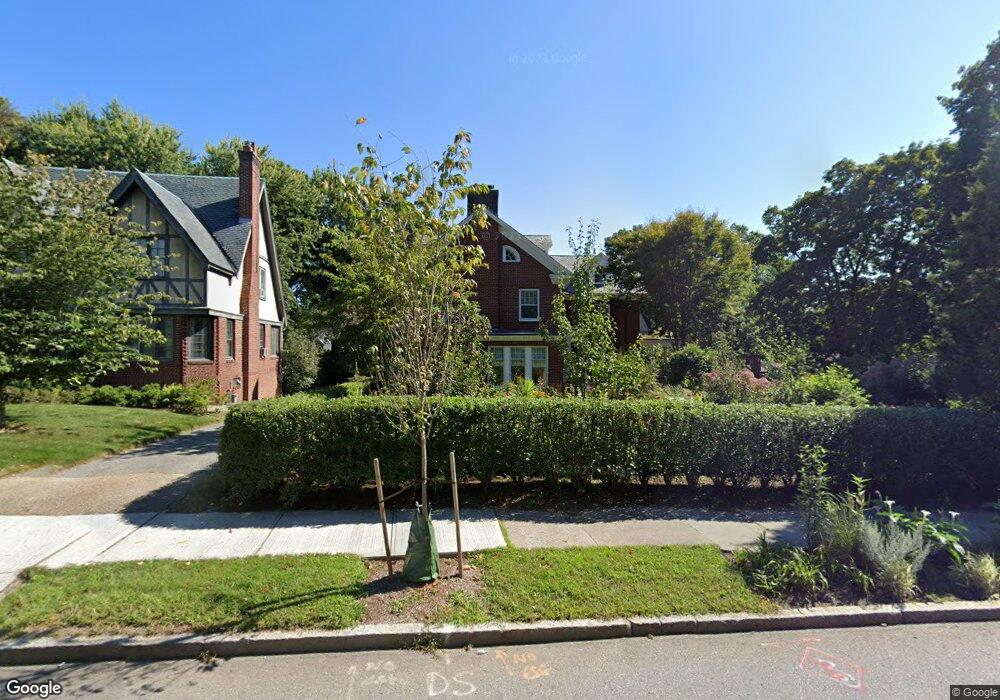
This home is located at 230 Salisbury St, Worcester, MA 01609 and is currently estimated at $876,578, approximately $213 per square foot. 230 Salisbury St is a home located in Worcester County with nearby schools including Jacob Hiatt Magnet School, Chandler Magnet, and Flagg Street School.
Ownership History
We collect this data history from publicly available records. To have your information removed, we recommend requesting removal directly through your county’s website.
Purchase Details
Purchase Details
Home Financials for this Owner
Home Financials are based on the most recent Mortgage that was taken out on this home.Home Values in the Area
Average Home Value in this Area
Purchase History
We collect this data history from publicly available records. To have your information removed, we recommend requesting removal directly through your county’s website.
| Date | Buyer | Sale Price | Title Company |
|---|---|---|---|
| -- | None Available | ||
| $450,000 | -- |
Mortgage History
We collect this data history from publicly available records. To have your information removed, we recommend requesting removal directly through your county’s website.
| Date | Status | Borrower | Loan Amount |
|---|---|---|---|
| Previous Owner | $360,000 |
Tax History
We collect this data history from publicly available records. To have your information removed, we recommend requesting removal directly through your county’s website.
| Year | Tax Paid | Tax Assessment Tax Assessment Total Assessment is a certain percentage of the fair market value that is determined by local assessors to be the total taxable value of land and additions on the property. | Land | Improvement |
|---|---|---|---|---|
| 2025 | $10,060 | $762,700 | $118,800 | $643,900 |
| 2024 | $9,749 | $709,000 | $118,800 | $590,200 |
| 2023 | $9,464 | $660,000 | $103,300 | $556,700 |
| 2022 | $8,857 | $582,300 | $82,700 | $499,600 |
| 2021 | $8,796 | $540,300 | $66,100 | $474,200 |
| 2020 | $8,792 | $517,200 | $66,100 | $451,100 |
| 2019 | $8,816 | $489,800 | $59,600 | $430,200 |
| 2018 | $8,687 | $459,400 | $59,600 | $399,800 |
| 2017 | $8,674 | $451,300 | $59,600 | $391,700 |
| 2016 | $8,201 | $397,900 | $43,900 | $354,000 |
| 2015 | $7,986 | $397,900 | $43,900 | $354,000 |
| 2014 | $7,775 | $397,900 | $43,900 | $354,000 |
Map
- 8 Montvale Rd
- 22 Whitman Rd
- 5 Algonquin Rd
- 35 North St
- 335 Salisbury St
- 7 Chadwick St
- 10 Pine Tree Ln
- 45 Pine Tree Dr
- 10 Hemans St Unit 21
- 80 Salisbury St Unit 101
- 32 Terrace Dr
- 10 Trowbridge Rd
- 32 Hemans St
- 4 Trowbridge Rd
- 112 Newton Ave N
- 23 Germain St
- 9 Dover St
- 119 Newton Ave N
- 167 Highland St
- 60 Fruit St
Ask me questions while you tour the home.