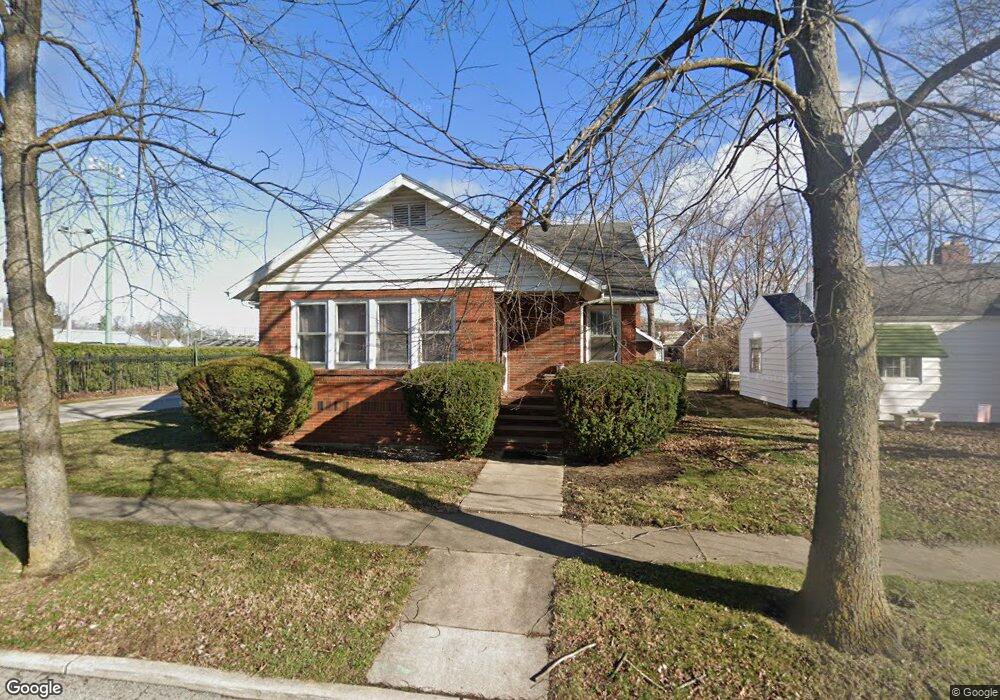
230 Stadium Dr Findlay, OH 45840
Estimated Value: $153,000 - $208,000
2
Beds
2
Baths
1,621
Sq Ft
$107/Sq Ft
Est. Value
About This Home
This home is located at 230 Stadium Dr, Findlay, OH 45840 and is currently estimated at $172,743, approximately $106 per square foot. 230 Stadium Dr is a home located in Hancock County with nearby schools including Jefferson Elementary School, Chamberlin Hill Elementary School, and Donnell Middle School.
Ownership History
Date
Name
Owned For
Owner Type
Purchase Details
Closed on
May 21, 1981
Bought by
Miles Frank A and Miles Gladys M
Current Estimated Value
Create a Home Valuation Report for This Property
The Home Valuation Report is an in-depth analysis detailing your home's value as well as a comparison with similar homes in the area
Home Values in the Area
Average Home Value in this Area
Purchase History
| Date | Buyer | Sale Price | Title Company |
|---|---|---|---|
| Miles Frank A | -- | -- |
Source: Public Records
Tax History
| Year | Tax Paid | Tax Assessment Tax Assessment Total Assessment is a certain percentage of the fair market value that is determined by local assessors to be the total taxable value of land and additions on the property. | Land | Improvement |
|---|---|---|---|---|
| 2024 | $1,619 | $44,410 | $6,320 | $38,090 |
| 2023 | $1,622 | $44,410 | $6,320 | $38,090 |
| 2022 | $1,616 | $44,410 | $6,320 | $38,090 |
| 2021 | $1,472 | $35,250 | $6,460 | $28,790 |
| 2020 | $1,472 | $35,250 | $6,460 | $28,790 |
| 2019 | $1,443 | $35,250 | $6,460 | $28,790 |
| 2018 | $1,346 | $30,120 | $4,550 | $25,570 |
| 2017 | $672 | $30,120 | $4,550 | $25,570 |
| 2016 | $1,334 | $30,120 | $4,550 | $25,570 |
| 2015 | $1,063 | $23,640 | $3,900 | $19,740 |
| 2014 | $1,063 | $23,640 | $3,900 | $19,740 |
| 2012 | $1,298 | $28,610 | $3,900 | $24,710 |
Source: Public Records
Map
Nearby Homes
- 324 W Mcpherson Ave
- 125 W Mcpherson Ave
- 1120 S West St
- 1041 S Main St
- 206 Greenlawn Ave
- 423 Elm St
- 313 2nd St
- 860 Hurd Ave
- 845 Hurd Ave
- 835 S Main St
- 815 Liberty St
- 423 1st St
- 829 Maple Ave
- 1215 S Blanchard St
- 400 E Pearl St
- 136 E Hobart Ave
- 731 5th St
- 514 Liberty St
- 209 E Hobart Ave
- 527 W Sandusky St
Your Personal Tour Guide
Ask me questions while you tour the home.