Estimated Value: $619,000 - $682,977
3
Beds
2
Baths
1,300
Sq Ft
$504/Sq Ft
Est. Value
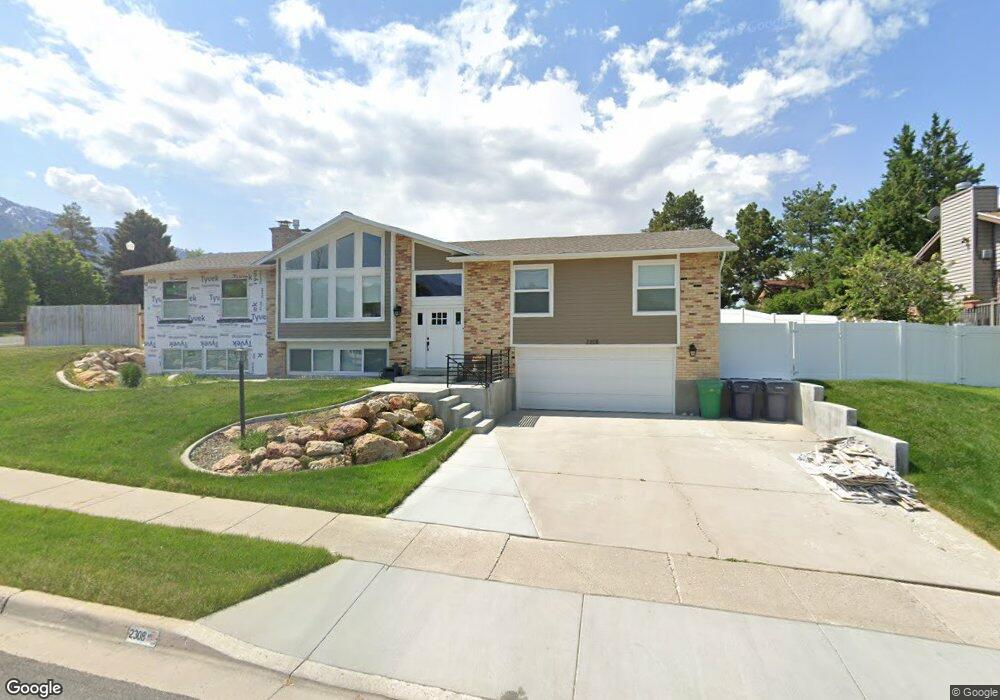
About This Home
This home is located at 2308 Falcon Way, Sandy, UT 84093 and is currently estimated at $655,244, approximately $504 per square foot. 2308 Falcon Way is a home located in Salt Lake County with nearby schools including Quail Hollow Elementary School, Albion Middle School, and Brighton High School.
Ownership History
Date
Name
Owned For
Owner Type
Purchase Details
Closed on
Aug 12, 2021
Sold by
Hansen Matthew
Bought by
Hansen Matthew
Current Estimated Value
Home Financials for this Owner
Home Financials are based on the most recent Mortgage that was taken out on this home.
Original Mortgage
$404,450
Outstanding Balance
$367,770
Interest Rate
2.9%
Mortgage Type
New Conventional
Estimated Equity
$287,474
Purchase Details
Closed on
Dec 4, 2018
Sold by
Hansen Matthew S
Bought by
Hensen Matthew
Home Financials for this Owner
Home Financials are based on the most recent Mortgage that was taken out on this home.
Original Mortgage
$328,000
Interest Rate
4.8%
Mortgage Type
New Conventional
Purchase Details
Closed on
Aug 15, 2017
Sold by
Lorensen Ronald B and Lorensen Diane
Bought by
Hansen Matthew S
Home Financials for this Owner
Home Financials are based on the most recent Mortgage that was taken out on this home.
Original Mortgage
$208,550
Interest Rate
3.96%
Mortgage Type
New Conventional
Create a Home Valuation Report for This Property
The Home Valuation Report is an in-depth analysis detailing your home's value as well as a comparison with similar homes in the area
Home Values in the Area
Average Home Value in this Area
Purchase History
We collect this data history from publicly available records. To have your information removed, we recommend requesting removal directly through your county’s website.
| Date | Buyer | Sale Price | Title Company |
|---|---|---|---|
| Hansen Matthew | -- | Title One | |
| Hensen Matthew | -- | Title One | |
| Hansen Matthew S | -- | Title One |
Source: Public Records
Mortgage History
We collect this data history from publicly available records. To have your information removed, we recommend requesting removal directly through your county’s website.
| Date | Status | Borrower | Loan Amount |
|---|---|---|---|
| Open | Hansen Matthew | $404,450 | |
| Closed | Hensen Matthew | $328,000 | |
| Previous Owner | Hansen Matthew S | $208,550 |
Source: Public Records
Tax History
| Year | Tax Paid | Tax Assessment Tax Assessment Total Assessment is a certain percentage of the fair market value that is determined by local assessors to be the total taxable value of land and additions on the property. | Land | Improvement |
|---|---|---|---|---|
| 2025 | $2,976 | $564,100 | $226,800 | $337,300 |
| 2024 | $2,976 | $557,800 | $218,300 | $339,500 |
| 2023 | $2,785 | $521,100 | $209,900 | $311,200 |
| 2022 | $2,856 | $525,700 | $205,800 | $319,900 |
| 2021 | $2,558 | $400,800 | $156,200 | $244,600 |
| 2020 | $2,162 | $319,700 | $156,200 | $163,500 |
| 2019 | $2,072 | $298,900 | $147,400 | $151,500 |
| 2018 | $1,906 | $287,500 | $147,400 | $140,100 |
| 2017 | $1,898 | $273,900 | $147,400 | $126,500 |
| 2016 | $1,733 | $241,800 | $132,800 | $109,000 |
| 2015 | $1,759 | $227,600 | $147,400 | $80,200 |
| 2014 | $1,705 | $216,700 | $143,400 | $73,300 |
Source: Public Records
Map
Nearby Homes
- 2156 E Falcon Way
- 9510 S 2280 E
- 2247 Willow Hills Dr
- 2534 E Grand Point Cir
- 2677 Grandview Dr
- 1930 E Southbridge Way
- 8752 Alta Cove Dr
- 9722 S Buttonwood Cir
- 2774 Willow Wick Dr
- 2196 Thistlewood Way
- 9969 Altamont Dr
- 8649 Alta Cove Dr
- 1879 Michael Way
- 2163 E Borg Dr
- 9577 S Hidden Pine Ln
- 1837 E Richard Rd
- 8585 Mount Majestic Rd
- 2014 Quartzridge Dr
- 9623 Tannenbaum Cove
- 8479 Escalante Dr
- 9206 Quail Run Dr
- 2296 Falcon Way
- 9170 Quail Run Dr
- 9221 Lexann Cir
- 2338 Falcon Way
- 9218 S Quail Run Dr
- 9218 Quail Run Dr
- 2338 E Falcon Way
- 9175 Quail Run Dr
- 2286 Falcon Way
- 2291 Falcon Way
- 9227 Lexann Cir
- 9193 S Shad Ln
- 9193 Shad Ln
- 2341 E Falcon Way
- 2341 Falcon Way
- 9158 Quail Run Dr
- 9209 Shad Ln
- 9230 Quail Run Dr
- 2346 E Falcon Way
Your Personal Tour Guide
Ask me questions while you tour the home.