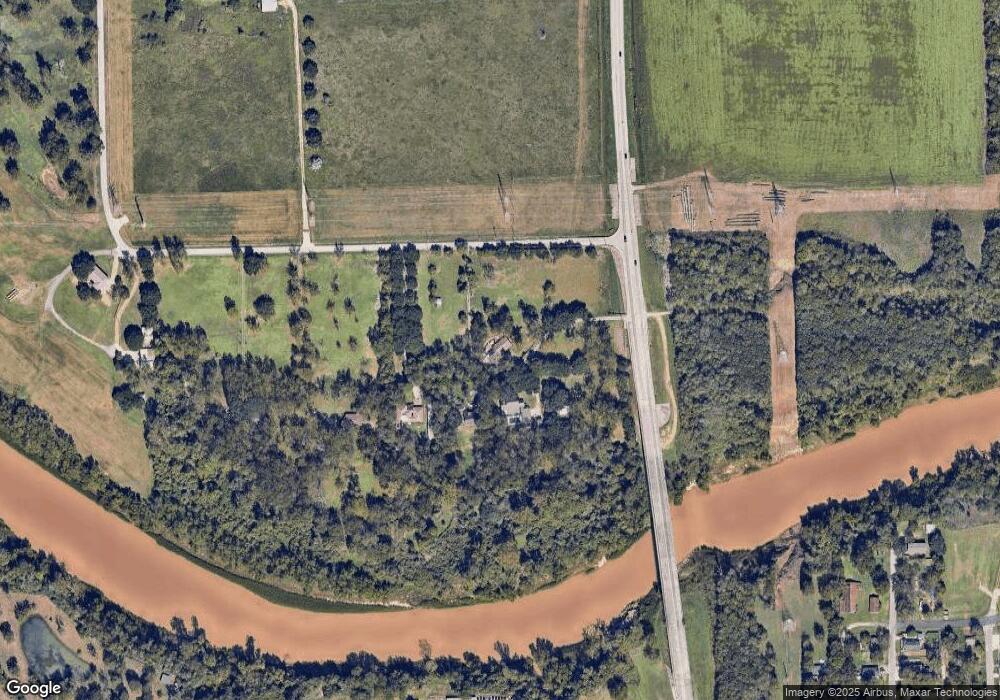
231 Baker Rd Rosenberg, TX 77471
Rosenberg AreaEstimated Value: $424,660 - $598,000
About This Home
This home is located at 231 Baker Rd, Rosenberg, TX 77471 and is currently estimated at $487,220, approximately $220 per square foot. 231 Baker Rd is a home located in Fort Bend County with nearby schools including Bentley Elementary School, Briscoe Junior High School, and Foster High School.
Ownership History
We collect this data history from publicly available records. To have your information removed, we recommend requesting removal directly through your county’s website.
Purchase Details
Purchase Details
Purchase Details
Purchase Details
Purchase History
We collect this data history from publicly available records. To have your information removed, we recommend requesting removal directly through your county’s website.
| Date | Buyer | Sale Price | Title Company |
|---|---|---|---|
| $18,900 | Charter Title Company | ||
| -- | Fidelity National Title | ||
| -- | -- | ||
| -- | -- |
Mortgage History
We collect this data history from publicly available records. To have your information removed, we recommend requesting removal directly through your county’s website.
| Date | Status | Borrower | Loan Amount |
|---|---|---|---|
| Previous Owner | $168,000 |
Tax History
We collect this data history from publicly available records. To have your information removed, we recommend requesting removal directly through your county’s website.
| Year | Tax Paid | Tax Assessment Tax Assessment Total Assessment is a certain percentage of the fair market value that is determined by local assessors to be the total taxable value of land and additions on the property. | Land | Improvement |
|---|---|---|---|---|
| 2025 | $4,924 | $378,643 | $273,108 | $151,103 |
| 2024 | $4,403 | $344,221 | $148,342 | $195,879 |
| 2023 | $4,403 | $312,928 | $66,504 | $246,424 |
| 2022 | $4,871 | $284,480 | $34,480 | $250,000 |
| 2021 | $5,366 | $258,620 | $97,880 | $160,740 |
| 2020 | $5,642 | $265,830 | $97,880 | $167,950 |
| 2019 | $5,520 | $241,660 | $97,880 | $143,780 |
| 2018 | $4,471 | $192,650 | $97,880 | $94,770 |
| 2017 | $5,252 | $225,020 | $97,880 | $127,140 |
| 2016 | $5,252 | $225,020 | $97,880 | $127,140 |
| 2015 | $4,494 | $216,330 | $93,320 | $123,010 |
| 2014 | $4,614 | $212,960 | $103,240 | $109,720 |
Map
Ask me questions while you tour the home.