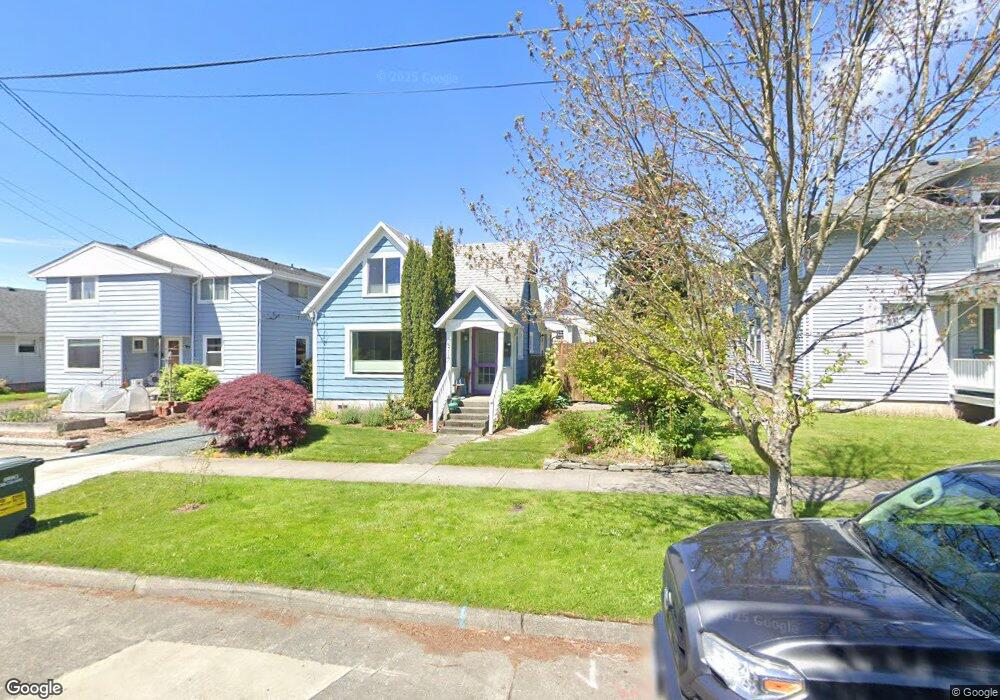
2317 E St Bellingham, WA 98225
Lettered Streets NeighborhoodEstimated Value: $575,000 - $606,000
2
Beds
1
Bath
1,195
Sq Ft
$494/Sq Ft
Est. Value
About This Home
This home is located at 2317 E St, Bellingham, WA 98225 and is currently estimated at $590,063, approximately $493 per square foot. 2317 E St is a home located in Whatcom County with nearby schools including Parkview Elementary School, Whatcom Middle School, and Bellingham High School.
Ownership History
Date
Name
Owned For
Owner Type
Purchase Details
Closed on
Apr 27, 2020
Sold by
Rees Dylan S and Crawford Lindsey M
Bought by
Rees Dylan S and Crawford Lindsey M
Current Estimated Value
Home Financials for this Owner
Home Financials are based on the most recent Mortgage that was taken out on this home.
Original Mortgage
$244,000
Outstanding Balance
$215,165
Interest Rate
3.5%
Mortgage Type
New Conventional
Estimated Equity
$374,898
Purchase Details
Closed on
Mar 22, 2017
Sold by
Moceri Construction Inc
Bought by
Rees Dylan S and Crawford Lindsey M
Home Financials for this Owner
Home Financials are based on the most recent Mortgage that was taken out on this home.
Original Mortgage
$261,600
Interest Rate
4.15%
Mortgage Type
New Conventional
Purchase Details
Closed on
Dec 21, 2016
Sold by
Solyst Mark E
Bought by
Moceri Construction Inc
Purchase Details
Closed on
Feb 18, 2004
Sold by
Barton Bruce A
Bought by
Solyst Mark E
Home Financials for this Owner
Home Financials are based on the most recent Mortgage that was taken out on this home.
Original Mortgage
$89,550
Interest Rate
5.85%
Mortgage Type
VA
Create a Home Valuation Report for This Property
The Home Valuation Report is an in-depth analysis detailing your home's value as well as a comparison with similar homes in the area
Home Values in the Area
Average Home Value in this Area
Purchase History
| Date | Buyer | Sale Price | Title Company |
|---|---|---|---|
| Rees Dylan S | -- | Chicago Title Company Of Wa | |
| Rees Dylan S | $327,000 | Chicago Title Co | |
| Moceri Construction Inc | $212,974 | Chicago Title Co | |
| Solyst Mark E | $91,200 | Chicago Title Insurance |
Source: Public Records
Mortgage History
| Date | Status | Borrower | Loan Amount |
|---|---|---|---|
| Open | Rees Dylan S | $244,000 | |
| Closed | Rees Dylan S | $261,600 | |
| Previous Owner | Solyst Mark E | $89,550 |
Source: Public Records
Tax History
| Year | Tax Paid | Tax Assessment Tax Assessment Total Assessment is a certain percentage of the fair market value that is determined by local assessors to be the total taxable value of land and additions on the property. | Land | Improvement |
|---|---|---|---|---|
| 2025 | $4,430 | $557,327 | $253,696 | $303,631 |
| 2024 | $4,319 | $541,088 | $246,304 | $294,784 |
| 2023 | $4,319 | $554,832 | $252,560 | $302,272 |
| 2022 | $3,526 | $478,312 | $217,728 | $260,584 |
| 2021 | $3,459 | $379,612 | $172,800 | $206,812 |
| 2020 | $2,938 | $351,493 | $160,000 | $191,493 |
| 2019 | $2,630 | $288,509 | $141,415 | $147,094 |
| 2018 | $2,649 | $258,986 | $126,965 | $132,021 |
| 2017 | $2,283 | $222,977 | $109,310 | $113,667 |
| 2016 | $1,998 | $200,852 | $98,090 | $102,762 |
| 2015 | $1,959 | $183,042 | $89,590 | $93,452 |
| 2014 | -- | $173,664 | $85,000 | $88,664 |
| 2013 | -- | $161,804 | $73,500 | $88,304 |
Source: Public Records
Map
Nearby Homes
- 10 E St
- 9 E St
- 0 D St
- 2500 Cornwall Ave
- 2101 Young St
- 1310 Ellsworth St
- 2517 Peabody St
- 1112 Cornwall Ave
- 809 W Connecticut St
- 403 Alabama St
- 409 Kentucky St
- 2119 Humboldt St
- 1011 Bancroft St Unit 204
- 503 W Illinois St
- 2600 Elm St
- 605 Alabama St
- 1310 G St
- 1315 Astor St
- 1200 W Holly St
- 2950 Plymouth Dr
Your Personal Tour Guide
Ask me questions while you tour the home.