233 Shore Rd Westerly, RI 02891
Estimated Value: $1,049,000 - $1,318,000
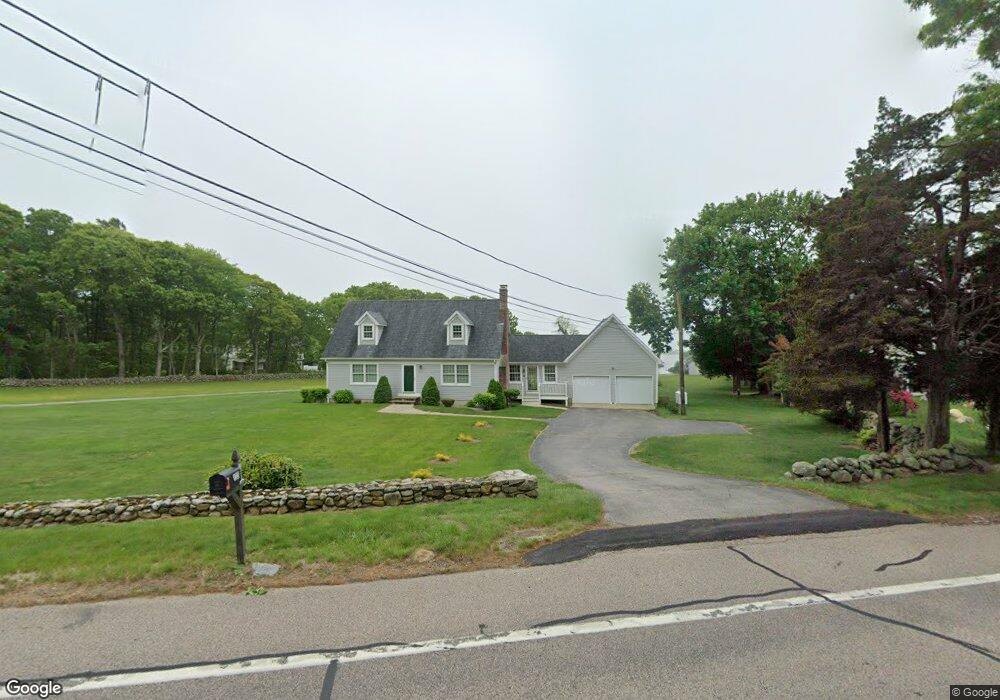
About This Home
This home is located at 233 Shore Rd, Westerly, RI 02891 and is currently estimated at $1,189,697, approximately $552 per square foot. 233 Shore Rd is a home located in Washington County with nearby schools including Westerly High School.
Ownership History
We collect this data history from publicly available records. To have your information removed, we recommend requesting removal directly through your county’s website.
Purchase Details
Purchase Details
Home Values in the Area
Average Home Value in this Area
Purchase History
We collect this data history from publicly available records. To have your information removed, we recommend requesting removal directly through your county’s website.
| Date | Buyer | Sale Price | Title Company |
|---|---|---|---|
| -- | -- | ||
| -- | -- | ||
| -- | -- |
Mortgage History
We collect this data history from publicly available records. To have your information removed, we recommend requesting removal directly through your county’s website.
| Date | Status | Borrower | Loan Amount |
|---|---|---|---|
| Previous Owner | $100,000 | ||
| Previous Owner | $25,000 | ||
| Previous Owner | $63,500 |
Tax History
We collect this data history from publicly available records. To have your information removed, we recommend requesting removal directly through your county’s website.
| Year | Tax Paid | Tax Assessment Tax Assessment Total Assessment is a certain percentage of the fair market value that is determined by local assessors to be the total taxable value of land and additions on the property. | Land | Improvement |
|---|---|---|---|---|
| 2025 | $7,735 | $1,087,900 | $592,800 | $495,100 |
| 2024 | $8,458 | $862,200 | $425,100 | $437,100 |
| 2023 | $8,294 | $862,200 | $425,100 | $437,100 |
| 2022 | $8,243 | $862,200 | $425,100 | $437,100 |
| 2021 | $8,040 | $697,900 | $370,300 | $327,600 |
| 2020 | $7,759 | $686,000 | $370,300 | $315,700 |
| 2019 | $7,683 | $686,000 | $370,300 | $315,700 |
| 2018 | $7,683 | $646,700 | $370,300 | $276,400 |
| 2017 | $7,495 | $646,700 | $370,300 | $276,400 |
| 2016 | $7,344 | $628,800 | $370,300 | $258,500 |
| 2015 | $6,099 | $563,700 | $377,500 | $186,200 |
| 2014 | $5,998 | $563,700 | $377,500 | $186,200 |
Map
- 229 Shore Rd
- 44 Rock Ridge Rd
- 28 Rock Ridge Rd
- 30 Wicklow Rd
- 189 Shore Rd
- 20 Vio Roma Rd
- 19 Moonlight Dr
- 5 Wicklow Rd
- 30 Clifford Dr
- 17 Clifford Dr
- 20 Snowberry Ln
- 10 Island View Ct
- 446 Atlantic Ave
- 497 Atlantic Ave
- 408 Atlantic Ave
- 419 Atlantic Ave
- 399 Atlantic Ave
- 9 Newbury Dr
- 14 Newbury Dr
- 32 Breach Dr
- 3 Rock Ridge Rd
- 3 Rockridge Rd
- 6 Rock Ridge Rd
- 7 Rock Ridge Rd
- 6 Rockridge Rd
- 4 Rock Ridge Rd
- 2 Rockridge Rd
- 2 Rock Ridge Rd
- 230 Shore Rd
- 227 Shore Rd
- 10 Rockridge Rd
- 232 Shore Rd
- 10 Rock Ridge Rd
- 225 Shore Rd
- 8 Rock Ridge Rd
- 8 Rockridge Road Westerly
- 13 Rock Ridge Rd
- 12 Rock Ridge Rd
- 223 Shore Rd
- 9 Littlebrook Rd
Ask me questions while you tour the home.