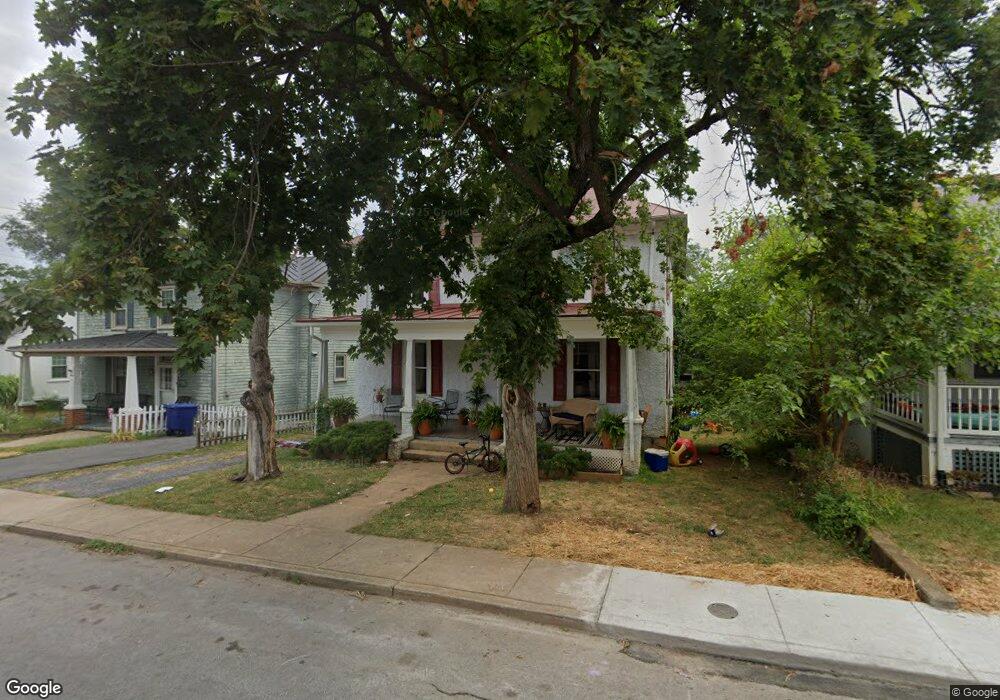
234 Lee St Front Royal, VA 22630
Estimated Value: $339,000 - $395,000
4
Beds
2
Baths
2,048
Sq Ft
$179/Sq Ft
Est. Value
About This Home
This home is located at 234 Lee St, Front Royal, VA 22630 and is currently estimated at $366,029, approximately $178 per square foot. 234 Lee St is a home located in Warren County with nearby schools including Ressie Jeffries Elementary School, Warren County High School, and Mountain Laurel Montessori School.
Ownership History
Date
Name
Owned For
Owner Type
Purchase Details
Closed on
Dec 16, 2013
Sold by
Lindsay Christopher M
Bought by
Stone Stream Llc
Current Estimated Value
Purchase Details
Closed on
Nov 12, 2010
Sold by
Fannie Mae
Bought by
Lindsay Christopher M
Home Financials for this Owner
Home Financials are based on the most recent Mortgage that was taken out on this home.
Original Mortgage
$113,905
Interest Rate
4.3%
Mortgage Type
New Conventional
Purchase Details
Closed on
Jun 14, 2010
Sold by
Muncy Johnie R
Bought by
Federal National Mortgage Association
Create a Home Valuation Report for This Property
The Home Valuation Report is an in-depth analysis detailing your home's value as well as a comparison with similar homes in the area
Home Values in the Area
Average Home Value in this Area
Purchase History
We collect this data history from publicly available records. To have your information removed, we recommend requesting removal directly through your county’s website.
| Date | Buyer | Sale Price | Title Company |
|---|---|---|---|
| Stone Stream Llc | $120,000 | Clear Title & Escrow | |
| Lindsay Christopher M | $119,900 | -- | |
| Federal National Mortgage Association | $217,192 | -- |
Source: Public Records
Mortgage History
We collect this data history from publicly available records. To have your information removed, we recommend requesting removal directly through your county’s website.
| Date | Status | Borrower | Loan Amount |
|---|---|---|---|
| Previous Owner | Lindsay Christopher M | $113,905 |
Source: Public Records
Tax History
| Year | Tax Paid | Tax Assessment Tax Assessment Total Assessment is a certain percentage of the fair market value that is determined by local assessors to be the total taxable value of land and additions on the property. | Land | Improvement |
|---|---|---|---|---|
| 2026 | $1,749 | $365,072 | $51,600 | $313,472 |
| 2025 | $1,749 | $365,072 | $51,600 | $313,472 |
| 2024 | $1,522 | $287,200 | $40,300 | $246,900 |
| 2023 | $1,407 | $287,200 | $40,300 | $246,900 |
| 2022 | $1,296 | $197,900 | $35,000 | $162,900 |
| 2021 | $257 | $197,900 | $35,000 | $162,900 |
| 2020 | $1,296 | $197,900 | $35,000 | $162,900 |
| 2019 | $1,296 | $197,900 | $35,000 | $162,900 |
| 2018 | $1,177 | $178,400 | $35,000 | $143,400 |
| 2017 | $1,160 | $178,400 | $35,000 | $143,400 |
| 2016 | $553 | $178,400 | $35,000 | $143,400 |
| 2015 | -- | $178,400 | $35,000 | $143,400 |
| 2014 | -- | $149,200 | $30,000 | $119,200 |
Source: Public Records
Map
Nearby Homes
- 214 S Royal Ave
- 211 Laurel St
- 305 Prospect St
- Lot 6, 5C, 5D Elsia Dr
- 234 Short St
- 227 Mosby Ln
- 231 Mosby Ln
- 124 Pimpernel Place
- 452 Acton St
- 210 Midway Ave
- 311 Grand Ave
- 316 Ritenour St
- 98 W Criser Rd
- 118 Mclendon Dr
- 602 and 604 Radham St
- 411 Kerfoot Ave
- 403 Kerfoot Ave
- 210 S Shenandoah Ave
- 125 W 4th St
- 220 Manassas Ave
Your Personal Tour Guide
Ask me questions while you tour the home.