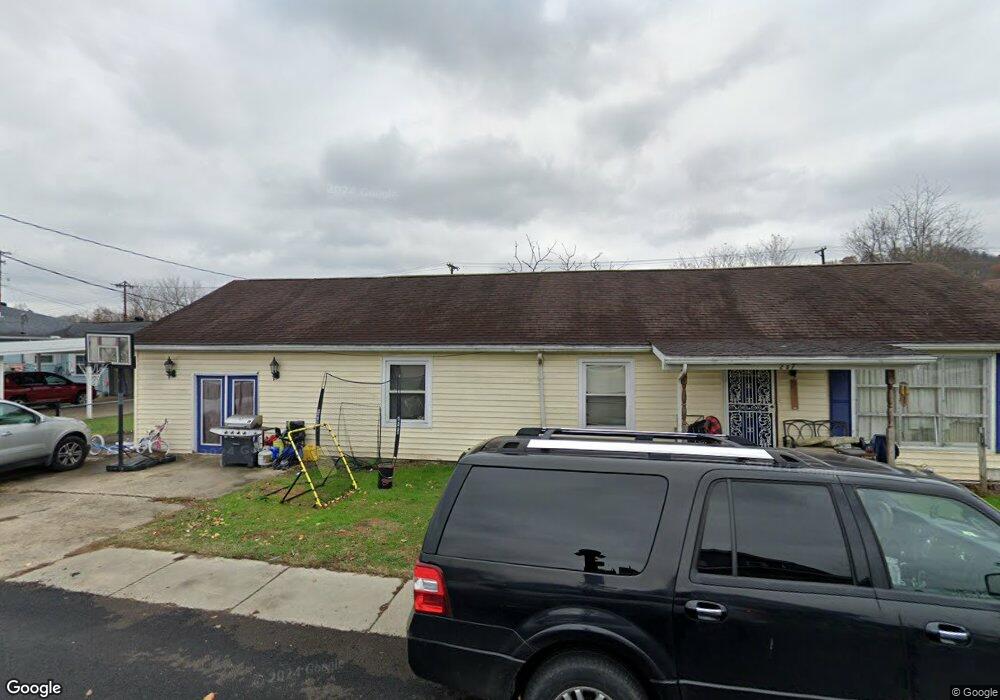
237 E 4th Ave South Shore, KY 41175
Estimated Value: $74,000 - $141,000
4
Beds
2
Baths
1,664
Sq Ft
$62/Sq Ft
Est. Value
About This Home
This home is located at 237 E 4th Ave, South Shore, KY 41175 and is currently estimated at $102,561, approximately $61 per square foot. 237 E 4th Ave is a home located in Greenup County with nearby schools including Greenup County High School, Notre Dame Elementary School, and Portsmouth Stem Academy.
Ownership History
Date
Name
Owned For
Owner Type
Purchase Details
Closed on
Aug 18, 2022
Sold by
Greenup Circuit Court
Bought by
Kinetic Resources Llc
Current Estimated Value
Purchase Details
Closed on
Aug 20, 2021
Sold by
Phillip Mckenzie
Bought by
Kinetic Resources Llc
Purchase Details
Closed on
Nov 18, 2008
Sold by
Homesales Inc
Bought by
Mckenzie Phillip
Create a Home Valuation Report for This Property
The Home Valuation Report is an in-depth analysis detailing your home's value as well as a comparison with similar homes in the area
Purchase History
| Date | Buyer | Sale Price | Title Company |
|---|---|---|---|
| Kinetic Resources Llc | $1,894,490 | None Listed On Document | |
| Kinetic Resources Llc | $1,858,880 | None Listed On Document | |
| Mckenzie Phillip | $45,000 | -- |
Source: Public Records
Tax History
| Year | Tax Paid | Tax Assessment Tax Assessment Total Assessment is a certain percentage of the fair market value that is determined by local assessors to be the total taxable value of land and additions on the property. | Land | Improvement |
|---|---|---|---|---|
| 2025 | $1,211 | $61,320 | $10,000 | $51,320 |
| 2024 | $1,204 | $61,320 | $10,000 | $51,320 |
| 2023 | $1,143 | $61,320 | $10,000 | $51,320 |
| 2022 | $1,117 | $61,320 | $10,000 | $51,320 |
| 2021 | $1,110 | $61,320 | $10,000 | $51,320 |
| 2020 | $1,076 | $61,320 | $10,000 | $51,320 |
| 2019 | $1,119 | $61,320 | $10,000 | $51,320 |
| 2018 | $1,146 | $61,320 | $10,000 | $51,320 |
| 2017 | $1,097 | $61,320 | $10,000 | $51,320 |
| 2016 | $1,097 | $61,320 | $10,000 | $51,320 |
| 2015 | $1,084 | $61,320 | $10,000 | $51,320 |
| 2014 | $1,069 | $61,320 | $10,000 | $51,320 |
| 2011 | -- | $61,320 | $10,000 | $51,320 |
Source: Public Records
Map
Nearby Homes
- 159 E Third Avenue (Blue)
- 159 E Third Avenue (Tan)
- 175 E 3rd Ave
- 45 W 3rd Ave
- 2 E 3rd Ave
- 199 James E Hannah Dr
- 1381 Kentucky 7
- 1818 Charles St
- 1711 Williams St
- 1705 Williams St
- 1913 6th St
- 1810 6th St
- 1635 6th St
- 437 Murray St
- 1544 6th St
- 1538 6th St
- 1324 Center St
- 1423 Center St
- 3015 Gallia St
- 1317 Lincoln St
Your Personal Tour Guide
Ask me questions while you tour the home.