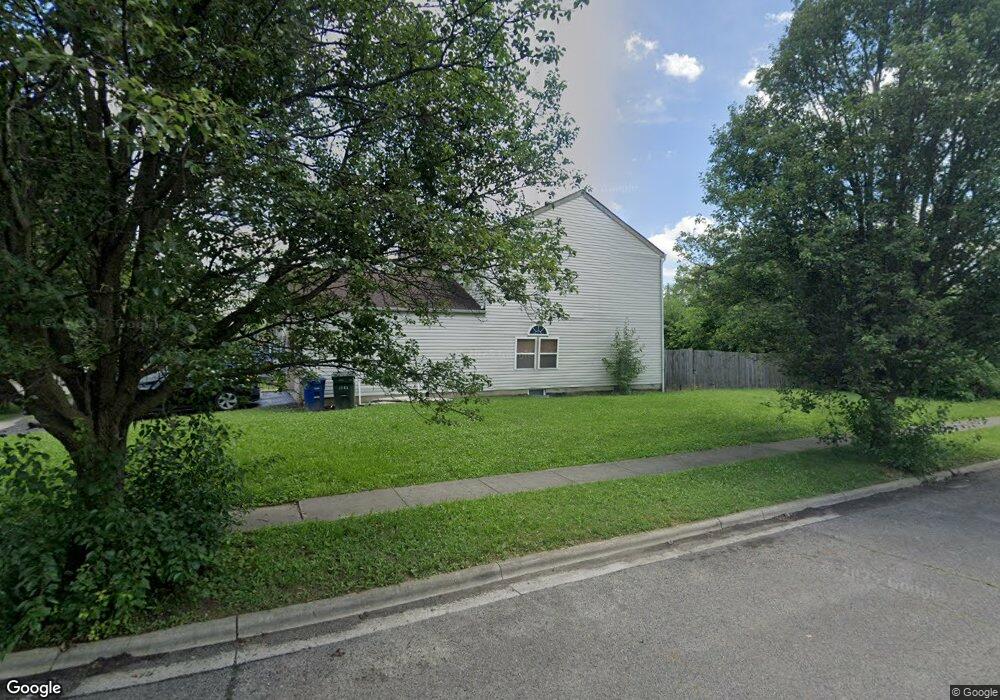
2385 Vining Dr Columbus, OH 43229
Forest Park East NeighborhoodEstimated Value: $314,000 - $396,000
3
Beds
3
Baths
1,824
Sq Ft
$190/Sq Ft
Est. Value
About This Home
This home is located at 2385 Vining Dr, Columbus, OH 43229 and is currently estimated at $345,699, approximately $189 per square foot. 2385 Vining Dr is a home located in Franklin County with nearby schools including Pointview Elementary School, Genoa Middle School, and Westerville-North High School.
Ownership History
Date
Name
Owned For
Owner Type
Purchase Details
Closed on
Nov 9, 2018
Sold by
Washington Jacqueline D and Atkins Services Llc
Bought by
Ammar Mohammed Ghiath
Current Estimated Value
Purchase Details
Closed on
Aug 22, 2018
Sold by
Washington Jacqueline D and Atkins Services Llc
Bought by
Ammar Mohammed Ghiath
Purchase Details
Closed on
Oct 17, 2000
Sold by
Bush Gerald D
Bought by
Washington Jacqueline D
Home Financials for this Owner
Home Financials are based on the most recent Mortgage that was taken out on this home.
Original Mortgage
$157,600
Interest Rate
7.77%
Mortgage Type
FHA
Purchase Details
Closed on
Dec 15, 1998
Sold by
Maronda Homes Inc
Bought by
Bush Gerald D
Home Financials for this Owner
Home Financials are based on the most recent Mortgage that was taken out on this home.
Original Mortgage
$148,950
Interest Rate
6.96%
Mortgage Type
VA
Create a Home Valuation Report for This Property
The Home Valuation Report is an in-depth analysis detailing your home's value as well as a comparison with similar homes in the area
Home Values in the Area
Average Home Value in this Area
Purchase History
| Date | Buyer | Sale Price | Title Company |
|---|---|---|---|
| Ammar Mohammed Ghiath | -- | None Available | |
| Ammar Mohammed Ghiath | $171,800 | None Available | |
| Washington Jacqueline D | $158,900 | Benchmark Title Agency Inc | |
| Bush Gerald D | $149,000 | Chicago Title |
Source: Public Records
Mortgage History
| Date | Status | Borrower | Loan Amount |
|---|---|---|---|
| Previous Owner | Washington Jacqueline D | $157,600 | |
| Previous Owner | Bush Gerald D | $148,950 |
Source: Public Records
Tax History
| Year | Tax Paid | Tax Assessment Tax Assessment Total Assessment is a certain percentage of the fair market value that is determined by local assessors to be the total taxable value of land and additions on the property. | Land | Improvement |
|---|---|---|---|---|
| 2025 | $4,391 | $86,030 | $19,250 | $66,780 |
| 2024 | $4,391 | $86,030 | $19,250 | $66,780 |
| 2023 | $4,288 | $86,030 | $19,250 | $66,780 |
| 2022 | $4,105 | $62,870 | $10,960 | $51,910 |
| 2021 | $4,145 | $62,870 | $10,960 | $51,910 |
| 2020 | $4,131 | $62,870 | $10,960 | $51,910 |
| 2019 | $3,469 | $50,260 | $8,750 | $41,510 |
| 2018 | $2,085 | $50,260 | $8,750 | $41,510 |
| 2017 | $3,311 | $50,260 | $8,750 | $41,510 |
| 2016 | $3,472 | $48,090 | $7,000 | $41,090 |
| 2015 | $3,480 | $48,090 | $7,000 | $41,090 |
| 2014 | $3,483 | $48,090 | $7,000 | $41,090 |
| 2013 | $1,911 | $52,990 | $7,350 | $45,640 |
Source: Public Records
Map
Nearby Homes
- 2414 Taymouth Rd
- 4687 Larkhall Ln
- 2162 Trent Rd
- 2177 Margo Rd
- 0 Chester Rd
- 0 Abington Rd Unit 225045775
- 0 Abington Rd Unit 224031704
- 0 Abington Rd Unit 224031738
- 0 Abington Rd Unit 224031699
- 0 Abington Rd Unit 225045777
- 2251 Tuliptree Ave
- 4772 Harr Ct
- 2601 Brooklyn Rd
- 2594 Adda Ave
- 2830 Minerva Ave
- 5177 Avalon Ave
- 4660 Glenhaven Dr
- 2901 Footloose Dr
- 2299 Belcher Dr
- 2655 Minerva Lake Rd
- 2391 Vining Dr
- 4798 Coatbridge Ln
- 2397 Vining Dr
- 4790 Coatbridge Ln
- 4809 Coatbridge Ln
- 4803 Coatbridge Ln
- 4791 Edinburgh Ln
- 4797 Coatbridge Ln
- 2403 Vining Dr
- 2382 Vining Dr
- 2388 Vining Dr
- 2376 Vining Dr
- 4815 Coatbridge Ln
- 4782 Coatbridge Ln
- 4791 Coatbridge Ln
- 2394 Vining Dr
- 4821 Coatbridge Ln
- 2400 Vining Dr
- 4775 Edinburgh Ln
- 4783 Coatbridge Ln
Your Personal Tour Guide
Ask me questions while you tour the home.