239 E Main St Mc Comb, OH 45858
McComb NeighborhoodEstimated Value: $84,000 - $201,000
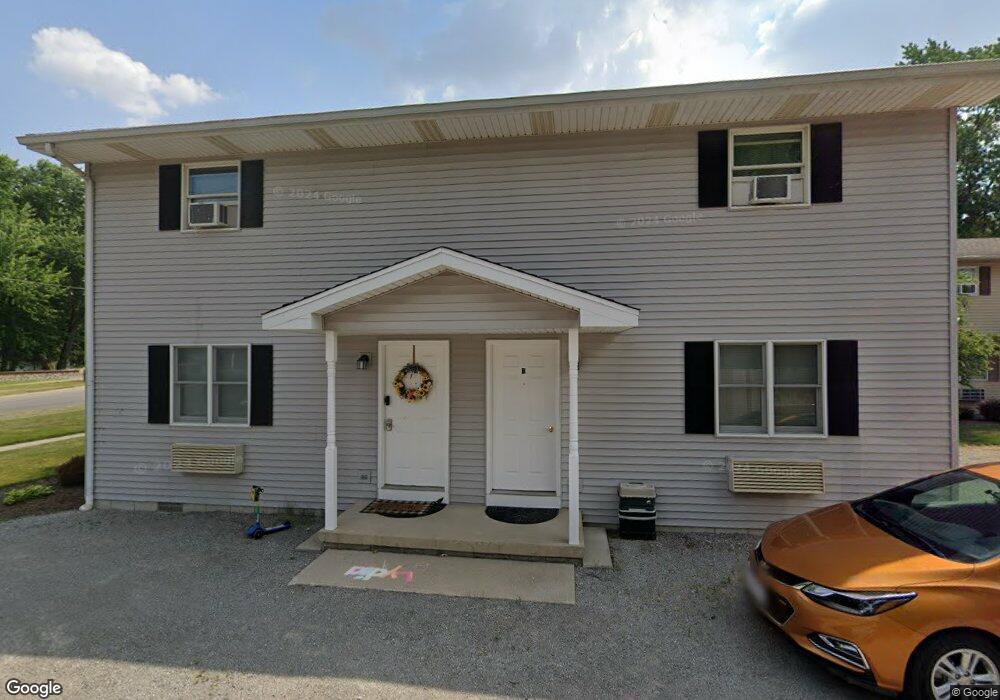
About This Home
This home is located at 239 E Main St, Mc Comb, OH 45858 and is currently estimated at $146,465, approximately $76 per square foot. 239 E Main St is a home with nearby schools including McComb Elementary School, McComb Middle School, and Mccomb Local High School.
Ownership History
We collect this data history from publicly available records. To have your information removed, we recommend requesting removal directly through your county’s website.
Purchase Details
Purchase Details
Home Values in the Area
Average Home Value in this Area
Purchase History
We collect this data history from publicly available records. To have your information removed, we recommend requesting removal directly through your county’s website.
| Date | Buyer | Sale Price | Title Company |
|---|---|---|---|
| -- | None Available | ||
| $99,500 | -- |
Mortgage History
We collect this data history from publicly available records. To have your information removed, we recommend requesting removal directly through your county’s website.
| Date | Status | Borrower | Loan Amount |
|---|---|---|---|
| Closed | $65,100 |
Tax History
We collect this data history from publicly available records. To have your information removed, we recommend requesting removal directly through your county’s website.
| Year | Tax Paid | Tax Assessment Tax Assessment Total Assessment is a certain percentage of the fair market value that is determined by local assessors to be the total taxable value of land and additions on the property. | Land | Improvement |
|---|---|---|---|---|
| 2025 | $1,871 | $53,250 | $4,590 | $48,660 |
| 2024 | $1,417 | $40,740 | $3,500 | $37,240 |
| 2023 | $1,408 | $40,740 | $3,500 | $37,240 |
| 2022 | $1,667 | $40,740 | $3,500 | $37,240 |
| 2021 | $1,540 | $33,940 | $3,500 | $30,440 |
| 2020 | $1,350 | $33,940 | $3,500 | $30,440 |
| 2019 | $1,475 | $33,940 | $3,500 | $30,440 |
| 2018 | $1,368 | $32,940 | $2,500 | $30,440 |
| 2017 | $1,376 | $32,940 | $2,500 | $30,440 |
| 2016 | $1,257 | $32,940 | $2,500 | $30,440 |
| 2015 | $1,039 | $26,120 | $2,140 | $23,980 |
| 2014 | $1,045 | $26,020 | $2,140 | $23,880 |
| 2012 | $1,495 | $35,310 | $2,140 | $33,170 |
Map
- 257 S Main St
- 116 Bond St
- 203 E Perrin Ave
- 125 Park Dr N
- 220 W Main St
- 4609 Township Road 235
- 512 W South St
- 100 Meadowcrest Dr
- 4506 Township Rd 123
- 0 Township Road 123 Township Road 123
- 7867 Driftwood Dr
- 2312 State Route 224
- 2312 U S 224
- 0 Rock Candy Rd Unit Lot 170
- 0 Rock Candy Rd Unit Lot 172 206819
- 0 Rock Candy Rd Unit Lot 162
- 0 Rock Candy Rd Unit Lot 171
- 0 Rock Candy Rd Unit Lot 168
- 9894 Smokies Way
- 0 Rock Candy Rd Or Bushwillow Dr Unit Lot 173
Ask me questions while you tour the home.