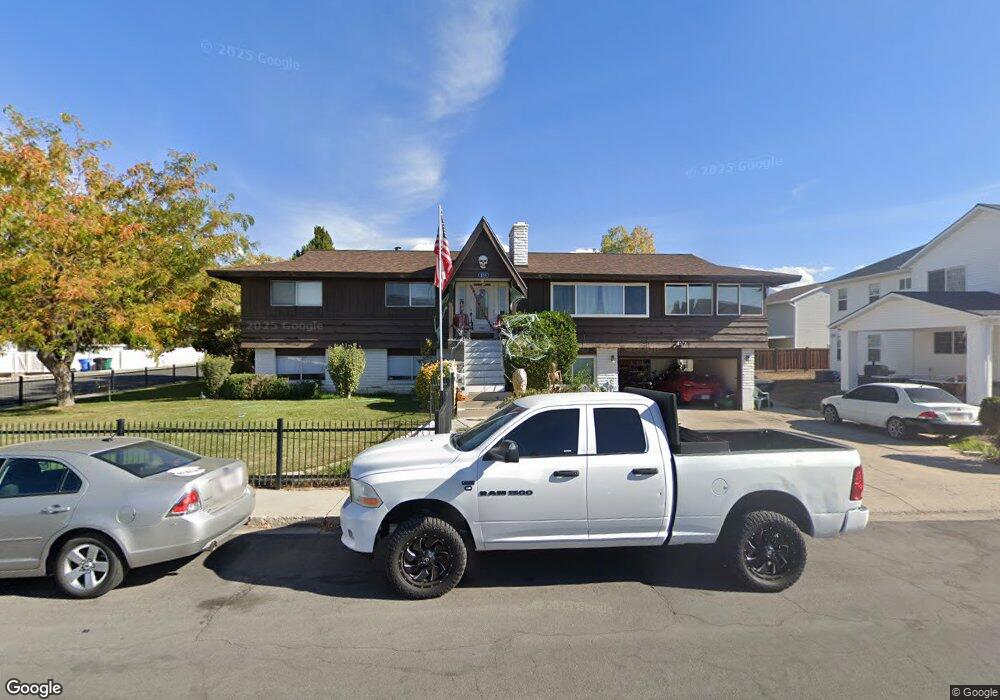
239 S Ridgecrest Dr Orem, UT 84058
Orem Park NeighborhoodEstimated Value: $542,017 - $634,000
3
Beds
2
Baths
1,764
Sq Ft
$323/Sq Ft
Est. Value
About This Home
This home is located at 239 S Ridgecrest Dr, Orem, UT 84058 and is currently estimated at $569,254, approximately $322 per square foot. 239 S Ridgecrest Dr is a home located in Utah County with nearby schools including Orem Elementary School, Orem Junior High School, and Mountain View High School.
Ownership History
Date
Name
Owned For
Owner Type
Purchase Details
Closed on
Jul 11, 2025
Sold by
Kay Benson Boley Living Trust and Cooper Angela D
Bought by
Mejia Jose Lisandro Her
Current Estimated Value
Home Financials for this Owner
Home Financials are based on the most recent Mortgage that was taken out on this home.
Original Mortgage
$461,487
Outstanding Balance
$459,111
Interest Rate
6.84%
Mortgage Type
FHA
Estimated Equity
$110,143
Purchase Details
Closed on
Mar 1, 2022
Sold by
Benson Boley Kay
Bought by
Kay Benson Boley Living Trust
Home Financials for this Owner
Home Financials are based on the most recent Mortgage that was taken out on this home.
Original Mortgage
$13,000
Interest Rate
3.14%
Mortgage Type
New Conventional
Purchase Details
Closed on
Jul 9, 2021
Sold by
Boley Kay and Kay Boley Family Trust
Bought by
Boley Kay Benson and Kay Benson Boley Living Trust
Purchase Details
Closed on
Sep 17, 2004
Sold by
Boley Kay
Bought by
Boley Kay and Kay Boley Family Trust
Home Financials for this Owner
Home Financials are based on the most recent Mortgage that was taken out on this home.
Original Mortgage
$15,000
Interest Rate
5.8%
Mortgage Type
Credit Line Revolving
Create a Home Valuation Report for This Property
The Home Valuation Report is an in-depth analysis detailing your home's value as well as a comparison with similar homes in the area
Home Values in the Area
Average Home Value in this Area
Purchase History
| Date | Buyer | Sale Price | Title Company |
|---|---|---|---|
| Mejia Jose Lisandro Her | -- | Secure Land Title | |
| Kay Benson Boley Living Trust | -- | Vanguard Title | |
| Boley Kay Benson | -- | Vanguard Title | |
| Boley Kay Benson | -- | None Available | |
| Boley Kay | -- | Horizon Title Insurance | |
| Boley Kay | -- | Horizon Title Insurance |
Source: Public Records
Mortgage History
| Date | Status | Borrower | Loan Amount |
|---|---|---|---|
| Open | Mejia Jose Lisandro Her | $461,487 | |
| Previous Owner | Boley Kay Benson | $13,000 | |
| Previous Owner | Boley Kay | $15,000 |
Source: Public Records
Tax History
| Year | Tax Paid | Tax Assessment Tax Assessment Total Assessment is a certain percentage of the fair market value that is determined by local assessors to be the total taxable value of land and additions on the property. | Land | Improvement |
|---|---|---|---|---|
| 2025 | $2,172 | $270,710 | -- | -- |
| 2024 | $2,172 | $265,650 | $0 | $0 |
| 2023 | $2,055 | $270,050 | $0 | $0 |
| 2022 | $2,002 | $254,870 | $0 | $0 |
| 2021 | $1,864 | $359,400 | $170,000 | $189,400 |
| 2020 | $1,740 | $321,700 | $136,000 | $185,700 |
| 2019 | $1,521 | $299,700 | $125,600 | $174,100 |
| 2018 | $1,485 | $279,700 | $108,100 | $171,600 |
| 2017 | $1,397 | $140,965 | $0 | $0 |
| 2016 | $1,371 | $127,490 | $0 | $0 |
| 2015 | $1,352 | $118,910 | $0 | $0 |
| 2014 | $1,340 | $117,370 | $0 | $0 |
Source: Public Records
Map
Nearby Homes
- 237 S Ridgeview Dr
- 935 W 360 S
- 365 S 1015 W
- 155 S 1200 W Unit 69
- 155 S 1200 W Unit 6
- 155 S 1200 W Unit 97
- 896 W 30 S
- 1148 W 285 S
- 278 S 1160 W
- 45 N 970 W
- 506 S 800 West St Unit 13
- 520 S 800 W Unit 14
- 350 S 1200 W Unit 2
- 570 S 800 West St Unit 15
- 1041 W 600 S
- 565 W 40 N
- 508 W 40 N
- 216 S 400 W
- 148 S 400 W
- 222 N 1200 W Unit 144
- 221 S 925 W Unit 4
- 221 S 925 W
- 909 W 225 S
- 920 W 260 S Unit 6
- 212 S 925 W
- 908 W 260 S
- 238 S Ridgecrest Dr
- 248 S Ridgecrest Dr
- 221 S Ridgecrest Dr
- 897 W 225 S
- 220 S Ridgecrest Dr
- 896 W 260 S
- 225 S Ridgeview Dr
- 262 S Ridgecrest Dr
- 270 S 900 W
- 229 S Ridgeview Dr
- 217 S Ridgeview Dr
- 271 S Ridgecrest Dr
- 885 W 225 S
- 212 S Ridgecrest Dr
Your Personal Tour Guide
Ask me questions while you tour the home.