239 Sterling Rd Lancaster, MA 01523
Estimated Value: $489,000 - $520,000
About This Home
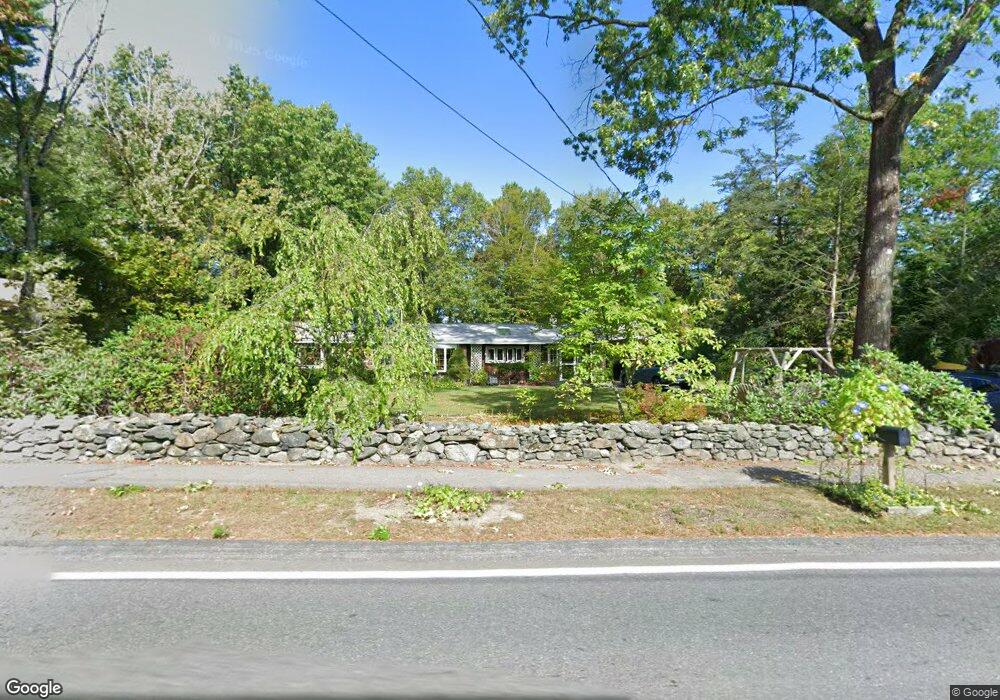
This home is located at 239 Sterling Rd, Lancaster, MA 01523 and is currently estimated at $509,459, approximately $307 per square foot. 239 Sterling Rd is a home located in Worcester County with nearby schools including Mary Rowlandson Elementary School, Luther Burbank Middle School, and Nashoba Regional High School.
Ownership History
We collect this data history from publicly available records. To have your information removed, we recommend requesting removal directly through your county’s website.
Purchase Details
Purchase Details
Home Values in the Area
Average Home Value in this Area
Purchase History
We collect this data history from publicly available records. To have your information removed, we recommend requesting removal directly through your county’s website.
| Date | Buyer | Sale Price | Title Company |
|---|---|---|---|
| -- | -- | ||
| -- | -- | ||
| -- | -- |
Mortgage History
We collect this data history from publicly available records. To have your information removed, we recommend requesting removal directly through your county’s website.
| Date | Status | Borrower | Loan Amount |
|---|---|---|---|
| Previous Owner | $50,000 | ||
| Previous Owner | $130,000 | ||
| Previous Owner | $105,000 | ||
| Previous Owner | $110,000 |
Tax History
We collect this data history from publicly available records. To have your information removed, we recommend requesting removal directly through your county’s website.
| Year | Tax Paid | Tax Assessment Tax Assessment Total Assessment is a certain percentage of the fair market value that is determined by local assessors to be the total taxable value of land and additions on the property. | Land | Improvement |
|---|---|---|---|---|
| 2025 | $6,493 | $401,800 | $108,000 | $293,800 |
| 2024 | $6,652 | $381,000 | $100,600 | $280,400 |
| 2023 | $6,108 | $355,300 | $91,400 | $263,900 |
| 2022 | $5,744 | $295,300 | $94,600 | $200,700 |
| 2021 | $5,604 | $280,500 | $94,600 | $185,900 |
| 2020 | $5,598 | $282,000 | $94,700 | $187,300 |
| 2019 | $5,184 | $262,500 | $94,700 | $167,800 |
| 2018 | $4,823 | $241,400 | $94,700 | $146,700 |
| 2016 | $4,502 | $230,300 | $93,800 | $136,500 |
| 2015 | $4,343 | $231,500 | $93,800 | $137,700 |
| 2014 | $4,323 | $228,600 | $93,800 | $134,800 |
Map
- 289 Sterling Rd
- 13 Mill St
- 0 Parker Rd
- 29 Bennett Ln
- 1185 Main St Unit 4
- 132 Kilbourn Rd
- 30 S Meadow Rd
- 59 S Meadow Rd
- 97 Sterling St
- 861 Main St
- 176 Mary Catherine Dr
- 49 Farm Land Ln
- 508 High St
- 51 Rigby St
- 251 High Street Extension
- 719 Main St
- 11 Eileen Ave
- 57 Clark St
- 305 High Street Extension
- 19 Brendan Rd
- 251 Sterling Rd
- 225 Sterling Rd
- 238 Sterling Rd
- 263 Sterling Rd
- 258 Sterling Rd
- 218 Sterling Rd
- 199 Sterling Rd
- 273 Sterling Rd
- 278 Sterling Rd
- 204 Sterling Rd
- 185 Sterling Rd
- 290 Sterling Rd
- 200 Sterling Rd
- 200 Sterling Rd Unit A
- 127 Goss Ln
- 186 Sterling Rd
- 298 Sterling Rd
- 175 Sterling Rd
- 306 Sterling Rd
- 172 Sterling Rd
Ask me questions while you tour the home.