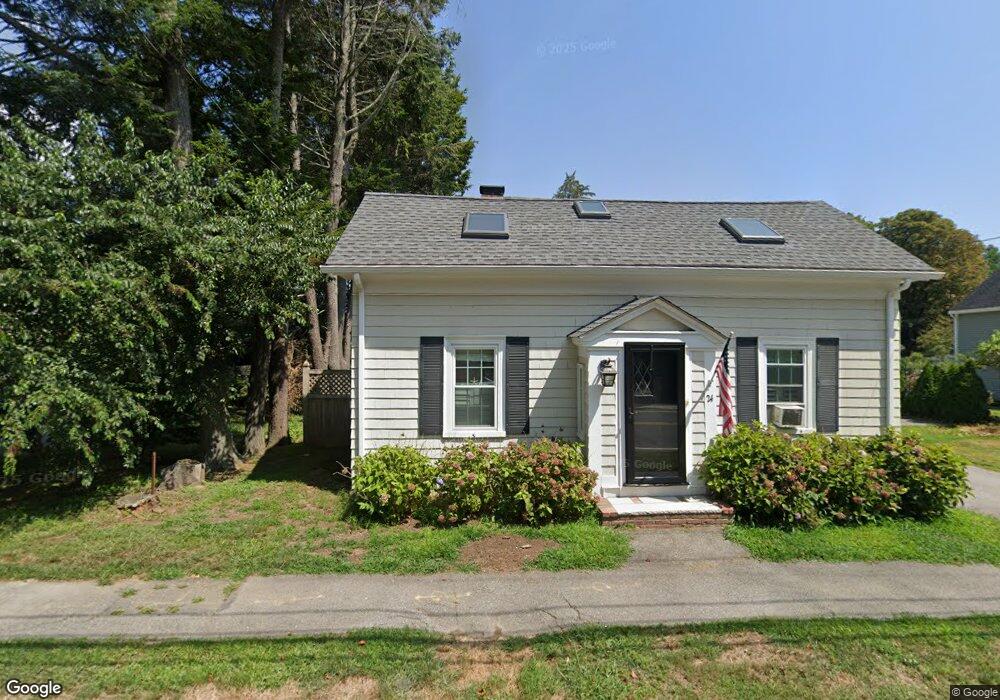
24 Arbor St Wenham, MA 01984
Estimated Value: $1,089,000 - $1,147,000
4
Beds
3
Baths
2,148
Sq Ft
$516/Sq Ft
Est. Value
About This Home
This home is located at 24 Arbor St, Wenham, MA 01984 and is currently estimated at $1,108,714, approximately $516 per square foot. 24 Arbor St is a home located in Essex County with nearby schools including Winthrop School, Bessie Buker Elementary School, and Cutler Elementary School.
Ownership History
Date
Name
Owned For
Owner Type
Purchase Details
Closed on
Feb 1, 2022
Sold by
Craig Randall and Craig Lisa M
Bought by
Craig Family Hldg T and Craig
Current Estimated Value
Purchase Details
Closed on
Mar 26, 2010
Sold by
Scarpa John A and Scarpa Denise A
Bought by
Craig Randall
Purchase Details
Closed on
Dec 4, 1992
Sold by
Morse Donald F and Morse Patricia A
Bought by
Scarpa John A and Scarpa Denise A
Create a Home Valuation Report for This Property
The Home Valuation Report is an in-depth analysis detailing your home's value as well as a comparison with similar homes in the area
Home Values in the Area
Average Home Value in this Area
Purchase History
| Date | Buyer | Sale Price | Title Company |
|---|---|---|---|
| Craig Family Hldg T | -- | None Available | |
| Craig Family Hldg T | -- | None Available | |
| Craig Family Hldg T | -- | None Available | |
| Craig Randall | $335,000 | -- | |
| Craig Randall | $335,000 | -- | |
| Scarpa John A | $190,000 | -- | |
| Scarpa John A | $190,000 | -- |
Source: Public Records
Mortgage History
| Date | Status | Borrower | Loan Amount |
|---|---|---|---|
| Previous Owner | Scarpa John A | $368,000 |
Source: Public Records
Tax History
| Year | Tax Paid | Tax Assessment Tax Assessment Total Assessment is a certain percentage of the fair market value that is determined by local assessors to be the total taxable value of land and additions on the property. | Land | Improvement |
|---|---|---|---|---|
| 2025 | $13,392 | $861,800 | $482,400 | $379,400 |
| 2024 | $11,548 | $737,400 | $482,400 | $255,000 |
| 2023 | $11,694 | $674,000 | $471,400 | $202,600 |
| 2022 | $10,186 | $520,200 | $323,300 | $196,900 |
| 2021 | $9,765 | $496,200 | $299,300 | $196,900 |
| 2020 | $9,118 | $481,400 | $299,400 | $182,000 |
| 2019 | $8,675 | $481,400 | $299,400 | $182,000 |
| 2018 | $8,202 | $436,500 | $289,700 | $146,800 |
| 2017 | $8,001 | $436,500 | $289,700 | $146,800 |
| 2016 | $7,412 | $436,500 | $289,700 | $146,800 |
| 2015 | $7,093 | $436,500 | $289,700 | $146,800 |
Source: Public Records
Map
Nearby Homes
Your Personal Tour Guide
Ask me questions while you tour the home.