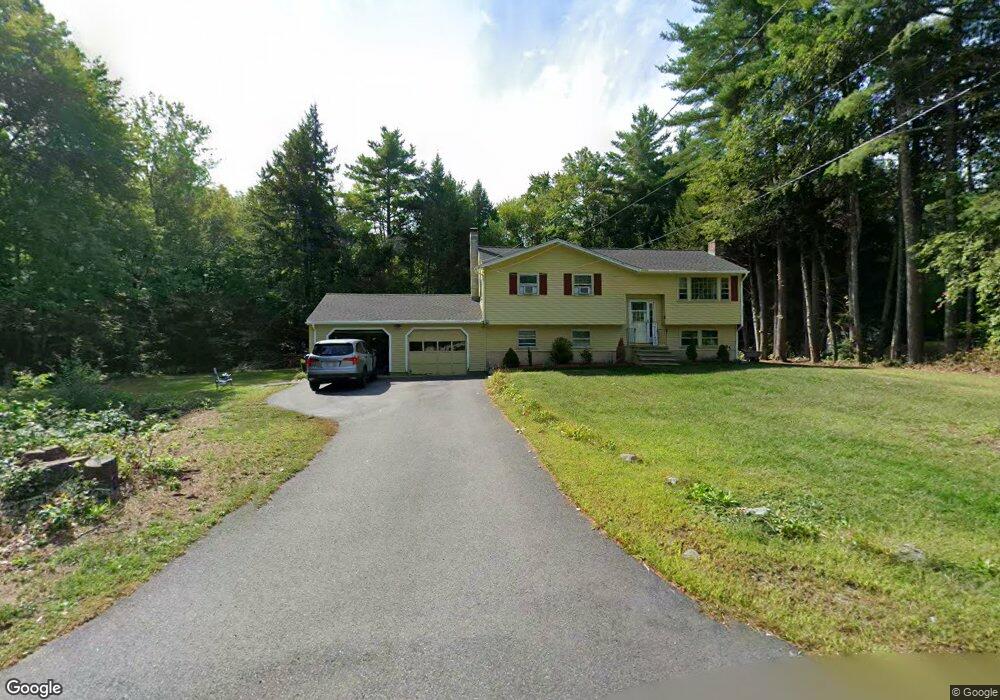
24 Bemis Rd Pepperell, MA 01463
Estimated Value: $546,000 - $634,000
3
Beds
2
Baths
1,842
Sq Ft
$321/Sq Ft
Est. Value
About This Home
This home is located at 24 Bemis Rd, Pepperell, MA 01463 and is currently estimated at $590,653, approximately $320 per square foot. 24 Bemis Rd is a home located in Middlesex County with nearby schools including North Middlesex Regional High School and Maple Dene & Moppet School.
Ownership History
Date
Name
Owned For
Owner Type
Purchase Details
Closed on
Aug 25, 2006
Sold by
Pinney Beverly Jean and Pinney Jay D
Bought by
Obrien Shawn
Current Estimated Value
Home Financials for this Owner
Home Financials are based on the most recent Mortgage that was taken out on this home.
Original Mortgage
$269,600
Outstanding Balance
$163,312
Interest Rate
6.83%
Mortgage Type
Purchase Money Mortgage
Estimated Equity
$427,341
Purchase Details
Closed on
Jun 7, 1994
Sold by
Cloukey Michael A and Cloukey Christine L
Bought by
Pinney Jay D and Pinney Beverly J
Home Financials for this Owner
Home Financials are based on the most recent Mortgage that was taken out on this home.
Original Mortgage
$115,560
Interest Rate
8.49%
Mortgage Type
Purchase Money Mortgage
Create a Home Valuation Report for This Property
The Home Valuation Report is an in-depth analysis detailing your home's value as well as a comparison with similar homes in the area
Home Values in the Area
Average Home Value in this Area
Purchase History
| Date | Buyer | Sale Price | Title Company |
|---|---|---|---|
| Obrien Shawn | $337,000 | -- | |
| Pinney Jay D | $128,400 | -- |
Source: Public Records
Mortgage History
| Date | Status | Borrower | Loan Amount |
|---|---|---|---|
| Open | Obrien Shawn | $269,600 | |
| Previous Owner | Pinney Jay D | $113,000 | |
| Previous Owner | Pinney Jay D | $115,560 |
Source: Public Records
Tax History
| Year | Tax Paid | Tax Assessment Tax Assessment Total Assessment is a certain percentage of the fair market value that is determined by local assessors to be the total taxable value of land and additions on the property. | Land | Improvement |
|---|---|---|---|---|
| 2025 | $7,211 | $492,900 | $147,100 | $345,800 |
| 2024 | $6,598 | $459,800 | $133,000 | $326,800 |
| 2023 | $6,816 | $450,200 | $133,000 | $317,200 |
| 2022 | $6,237 | $363,700 | $105,000 | $258,700 |
| 2021 | $6,156 | $343,500 | $91,000 | $252,500 |
| 2020 | $5,732 | $337,600 | $91,000 | $246,600 |
| 2019 | $5,267 | $317,500 | $91,000 | $226,500 |
| 2018 | $13,624 | $295,400 | $91,000 | $204,400 |
| 2017 | $4,578 | $288,100 | $91,000 | $197,100 |
| 2016 | $4,356 | $263,500 | $91,000 | $172,500 |
| 2015 | $4,203 | $263,500 | $91,000 | $172,500 |
| 2014 | $4,068 | $256,500 | $91,000 | $165,500 |
Source: Public Records
Map
Nearby Homes
Your Personal Tour Guide
Ask me questions while you tour the home.