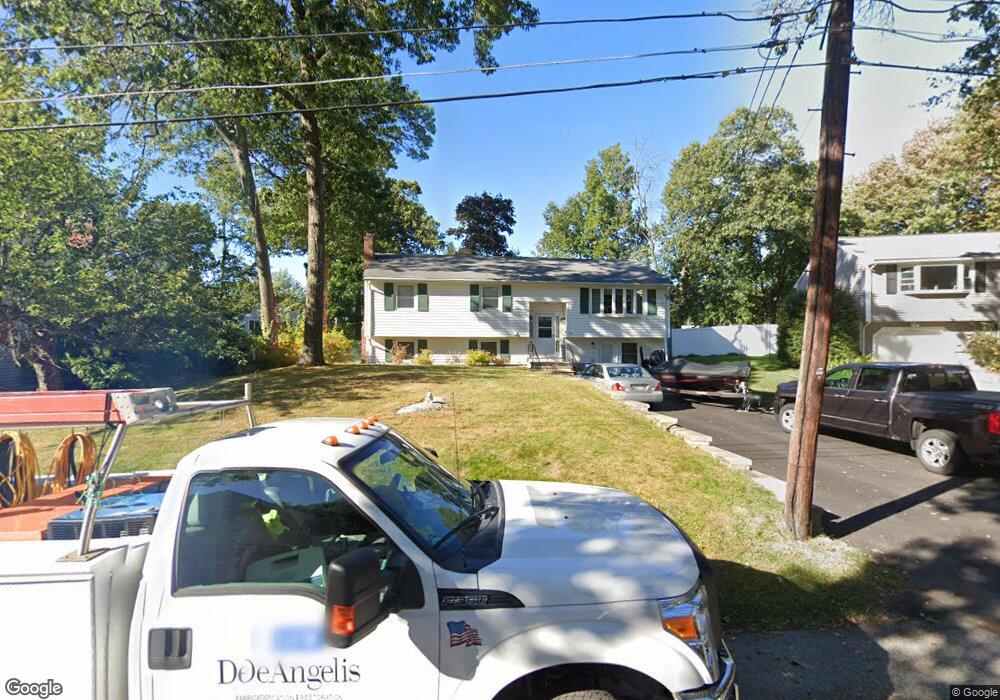
24 Catalpa St Wakefield, MA 01880
Montrose NeighborhoodEstimated Value: $793,000 - $885,000
4
Beds
2
Baths
1,784
Sq Ft
$478/Sq Ft
Est. Value
About This Home
This home is located at 24 Catalpa St, Wakefield, MA 01880 and is currently estimated at $852,070, approximately $477 per square foot. 24 Catalpa St is a home located in Middlesex County with nearby schools including Wakefield Memorial High School, St Joseph School, and Odyssey Day School.
Ownership History
Date
Name
Owned For
Owner Type
Purchase Details
Closed on
Oct 31, 2017
Sold by
Clarke Susan J
Bought by
Manchester Jodi L and Clarke Susan J
Current Estimated Value
Purchase Details
Closed on
Apr 30, 2004
Sold by
Amyouny James E and Amyouny Theresa A
Bought by
Manchester Jodi L and Clarke Susan J
Home Financials for this Owner
Home Financials are based on the most recent Mortgage that was taken out on this home.
Original Mortgage
$333,700
Interest Rate
5.36%
Mortgage Type
Purchase Money Mortgage
Create a Home Valuation Report for This Property
The Home Valuation Report is an in-depth analysis detailing your home's value as well as a comparison with similar homes in the area
Home Values in the Area
Average Home Value in this Area
Purchase History
We collect this data history from publicly available records. To have your information removed, we recommend requesting removal directly through your county’s website.
| Date | Buyer | Sale Price | Title Company |
|---|---|---|---|
| Manchester Jodi L | -- | -- | |
| Clarke Susan J | -- | -- | |
| Manchester Jodi L | $429,900 | -- |
Source: Public Records
Mortgage History
We collect this data history from publicly available records. To have your information removed, we recommend requesting removal directly through your county’s website.
| Date | Status | Borrower | Loan Amount |
|---|---|---|---|
| Previous Owner | Manchester Jodi L | $333,700 |
Source: Public Records
Tax History
| Year | Tax Paid | Tax Assessment Tax Assessment Total Assessment is a certain percentage of the fair market value that is determined by local assessors to be the total taxable value of land and additions on the property. | Land | Improvement |
|---|---|---|---|---|
| 2025 | $8,447 | $744,200 | $420,300 | $323,900 |
| 2024 | $7,790 | $692,400 | $391,000 | $301,400 |
| 2023 | $7,580 | $646,200 | $364,900 | $281,300 |
| 2022 | $7,110 | $577,100 | $325,800 | $251,300 |
| 2021 | $7,220 | $567,200 | $297,900 | $269,300 |
| 2020 | $6,790 | $531,700 | $279,300 | $252,400 |
| 2019 | $6,368 | $496,300 | $260,700 | $235,600 |
| 2018 | $6,140 | $474,100 | $249,000 | $225,100 |
| 2017 | $5,774 | $443,100 | $232,700 | $210,400 |
| 2016 | $5,659 | $419,500 | $229,800 | $189,700 |
| 2015 | $5,284 | $392,000 | $214,700 | $177,300 |
| 2014 | $4,888 | $382,500 | $209,500 | $173,000 |
Source: Public Records
Map
Nearby Homes
- 68 Preston St Unit 9D
- 68 Preston St Unit 3D
- 19 Butler Ave
- 234 Water St Unit 205
- 4 Wiley Place
- 6 Highland St
- 15 Hartshorne Rd
- 11 Columbia Rd Unit 8
- 4 Wakefield Ave Unit 4
- 9 Hart St
- 19 Wakefield Ave
- 361 Salem St Unit 2
- 20 Lawrence St Unit 2
- 398 Salem St
- 1 Traverse St Unit E
- 284 Main St
- 8 Everett St
- 50 Albion St
- 22 Sweetser St
- 175 North Ave Unit 407
Your Personal Tour Guide
Ask me questions while you tour the home.