24 Cliff St Malden, MA 02148
Forestdale NeighborhoodEstimated Value: $1,007,000 - $1,292,533
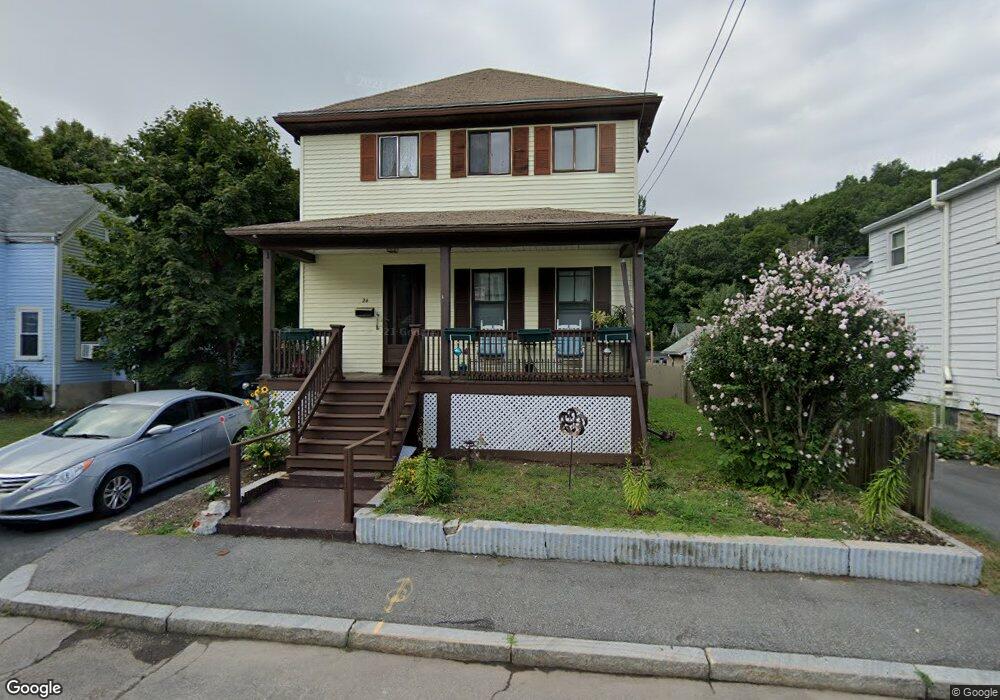
About This Home
This home is located at 24 Cliff St, Malden, MA 02148 and is currently estimated at $1,155,383, approximately $379 per square foot. 24 Cliff St is a home located in Middlesex County with nearby schools including Malden High School, Cheverus Centennial School, and Malden Catholic.
Ownership History
We collect this data history from publicly available records. To have your information removed, we recommend requesting removal directly through your county’s website.
Purchase Details
Home Financials for this Owner
Home Financials are based on the most recent Mortgage that was taken out on this home.Purchase Details
Purchase Details
Home Values in the Area
Average Home Value in this Area
Purchase History
We collect this data history from publicly available records. To have your information removed, we recommend requesting removal directly through your county’s website.
| Date | Buyer | Sale Price | Title Company |
|---|---|---|---|
| $380,000 | -- | ||
| $380,000 | -- | ||
| -- | -- | ||
| -- | -- | ||
| -- | -- | ||
| -- | -- |
Mortgage History
We collect this data history from publicly available records. To have your information removed, we recommend requesting removal directly through your county’s website.
| Date | Status | Borrower | Loan Amount |
|---|---|---|---|
| Open | $304,000 | ||
| Closed | $304,000 |
Tax History
We collect this data history from publicly available records. To have your information removed, we recommend requesting removal directly through your county’s website.
| Year | Tax Paid | Tax Assessment Tax Assessment Total Assessment is a certain percentage of the fair market value that is determined by local assessors to be the total taxable value of land and additions on the property. | Land | Improvement |
|---|---|---|---|---|
| 2025 | $123 | $1,084,600 | $435,400 | $649,200 |
| 2024 | $11,962 | $1,023,300 | $411,800 | $611,500 |
| 2023 | $11,296 | $926,700 | $376,600 | $550,100 |
| 2022 | $10,799 | $874,400 | $341,300 | $533,100 |
| 2021 | $10,386 | $845,100 | $312,000 | $533,100 |
| 2020 | $9,967 | $787,900 | $296,700 | $491,200 |
| 2019 | $7,009 | $528,200 | $282,600 | $245,600 |
| 2018 | $6,531 | $463,500 | $238,500 | $225,000 |
| 2017 | $6,409 | $452,300 | $238,500 | $213,800 |
| 2016 | $6,375 | $420,500 | $226,800 | $193,700 |
| 2015 | $6,212 | $394,900 | $213,900 | $181,000 |
| 2014 | $5,943 | $369,100 | $194,500 | $174,600 |
Map
- 65 Jacob St
- 71 Williams St
- 20 Hemenway Ct
- 29 Bowman St
- 2 Swains Pond Ave
- 35 Mount Washington Ave
- 5 Hemenway Ave
- 50-52 Bainbridge St
- 30-32 Goldcliff Rd
- 12 Mount Washington Ave
- 19 Lebanon St
- 635 Salem St
- 16 Hillside Park
- 123-125 Laurel St
- 131 Laurel St Unit C
- 131 Laurel St Unit C
- 0 Beachview Ave
- 548 Salem St
- 161 Webster St
- 292 Broadway
Ask me questions while you tour the home.