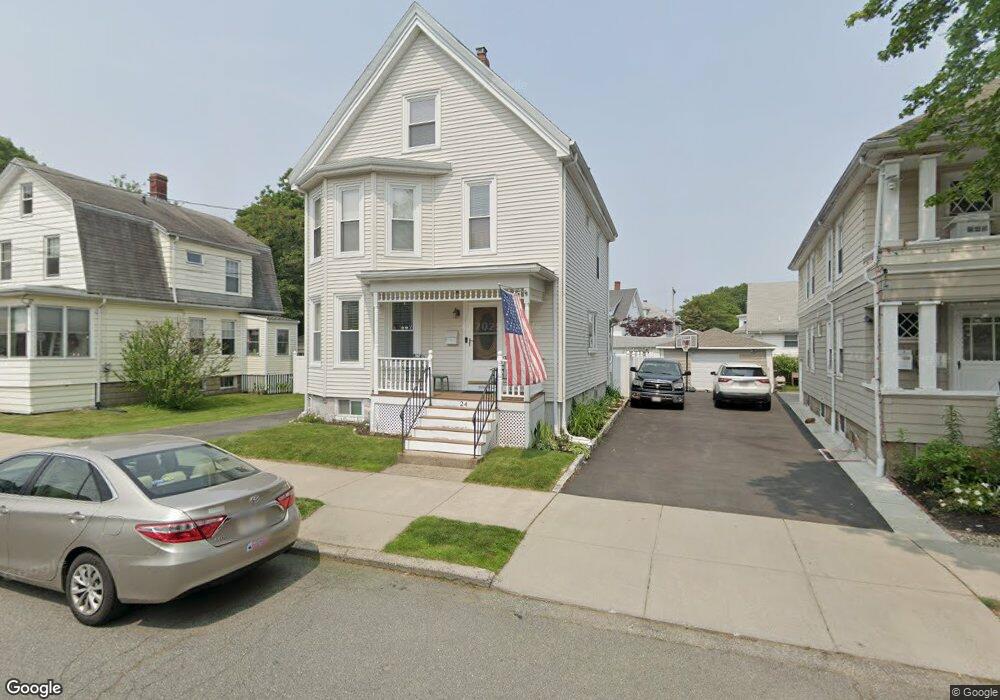
24 Gilbert St Lynn, MA 01902
Eastern Avenue NeighborhoodEstimated Value: $634,000 - $682,000
4
Beds
2
Baths
1,961
Sq Ft
$340/Sq Ft
Est. Value
About This Home
This home is located at 24 Gilbert St, Lynn, MA 01902 and is currently estimated at $667,322, approximately $340 per square foot. 24 Gilbert St is a home located in Essex County with nearby schools including Hood Elementary School, William R. Fallon School, and Marshall Middle School.
Ownership History
Date
Name
Owned For
Owner Type
Purchase Details
Closed on
May 9, 2022
Sold by
Comeau Joseph P and Comeau Nancy I
Bought by
Comeau Gilbery T and Comeau C
Current Estimated Value
Purchase Details
Closed on
Aug 1, 1982
Bought by
Comeau Joseph P and Comeau Nancy I
Create a Home Valuation Report for This Property
The Home Valuation Report is an in-depth analysis detailing your home's value as well as a comparison with similar homes in the area
Home Values in the Area
Average Home Value in this Area
Purchase History
We collect this data history from publicly available records. To have your information removed, we recommend requesting removal directly through your county’s website.
| Date | Buyer | Sale Price | Title Company |
|---|---|---|---|
| Comeau Gilbery T | -- | None Available | |
| Comeau Gilbery T | -- | None Available | |
| Comeau Gilbery T | -- | None Available | |
| Comeau Joseph P | $44,700 | -- |
Source: Public Records
Mortgage History
We collect this data history from publicly available records. To have your information removed, we recommend requesting removal directly through your county’s website.
| Date | Status | Borrower | Loan Amount |
|---|---|---|---|
| Previous Owner | Comeau Joseph P | $108,000 | |
| Previous Owner | Comeau Joseph P | $116,000 | |
| Previous Owner | Comeau Joseph P | $116,000 |
Source: Public Records
Tax History
| Year | Tax Paid | Tax Assessment Tax Assessment Total Assessment is a certain percentage of the fair market value that is determined by local assessors to be the total taxable value of land and additions on the property. | Land | Improvement |
|---|---|---|---|---|
| 2025 | $6,341 | $612,100 | $204,700 | $407,400 |
| 2024 | $5,704 | $541,700 | $192,500 | $349,200 |
| 2023 | $5,616 | $503,700 | $189,900 | $313,800 |
| 2022 | $5,545 | $446,100 | $152,800 | $293,300 |
| 2021 | $4,928 | $378,200 | $129,200 | $249,000 |
| 2020 | $4,867 | $363,200 | $126,100 | $237,100 |
| 2019 | $4,856 | $339,600 | $117,900 | $221,700 |
| 2018 | $4,507 | $297,500 | $127,000 | $170,500 |
| 2017 | $4,170 | $267,300 | $104,800 | $162,500 |
| 2016 | $3,786 | $234,000 | $105,200 | $128,800 |
| 2015 | $3,883 | $231,800 | $105,200 | $126,600 |
Source: Public Records
Map
Nearby Homes
- 10 Milton Ridge Rd Unit 10
- 431-433 Chatham St
- 70 Mudge St Unit 3
- 48 Saratoga St
- 68 Western Ave
- 467 Chatham St
- 13 Roy St Unit 3
- 30 Clifton Ave
- 12 Wass St
- 19 Brooklawn Terrace
- 88 Empire St
- 154-156 Tracy Ave
- 13 Essex St Unit 2
- 96 Burpee Rd Unit 1
- 141 Essex St
- 12 Eade St
- 7 Ward St
- 46 Brookline St
- 50-52 Allen Ave
- 187 Burrill St Unit 2
Your Personal Tour Guide
Ask me questions while you tour the home.