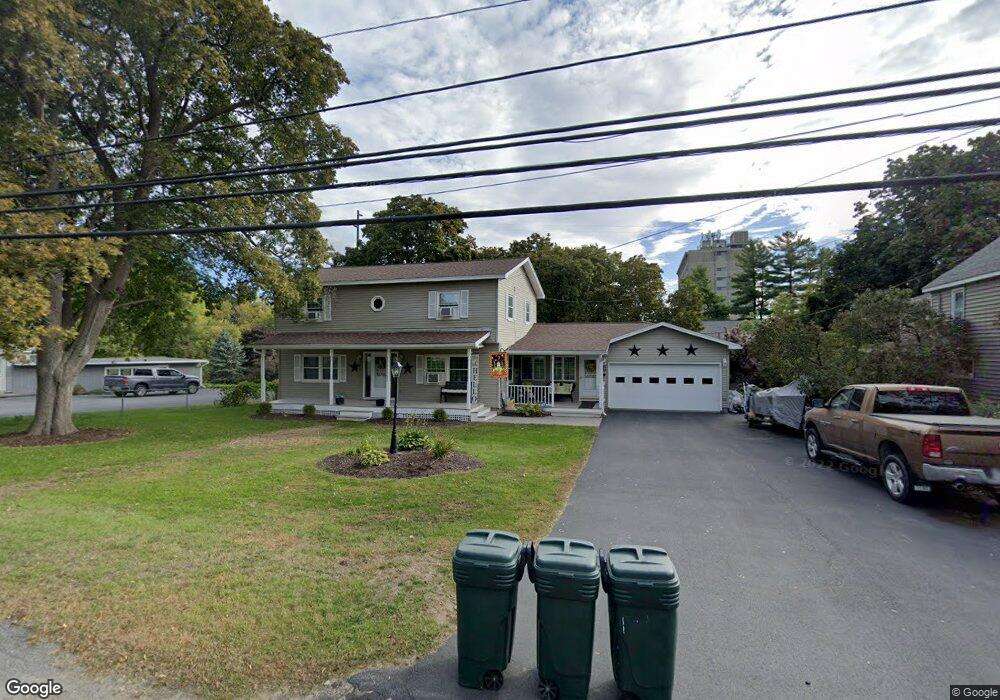
24 Halsey Ct Plattsburgh, NY 12901
Estimated Value: $274,410 - $329,000
6
Beds
2
Baths
2,276
Sq Ft
$134/Sq Ft
Est. Value
About This Home
This home is located at 24 Halsey Ct, Plattsburgh, NY 12901 and is currently estimated at $304,353, approximately $133 per square foot. 24 Halsey Ct is a home located in Clinton County with nearby schools including Thomas E. Glasgow Elementary School, Oak Street School, and Stafford Middle School.
Ownership History
Date
Name
Owned For
Owner Type
Purchase Details
Closed on
Jun 17, 2010
Sold by
Swoboda Albert Kern
Bought by
Weslowski Lawrence
Current Estimated Value
Home Financials for this Owner
Home Financials are based on the most recent Mortgage that was taken out on this home.
Original Mortgage
$99,200
Outstanding Balance
$61,633
Interest Rate
5.03%
Mortgage Type
Purchase Money Mortgage
Estimated Equity
$242,720
Purchase Details
Closed on
Nov 22, 2007
Sold by
Swoboda Susan
Bought by
Swoboda Kern
Create a Home Valuation Report for This Property
The Home Valuation Report is an in-depth analysis detailing your home's value as well as a comparison with similar homes in the area
Home Values in the Area
Average Home Value in this Area
Purchase History
| Date | Buyer | Sale Price | Title Company |
|---|---|---|---|
| Weslowski Lawrence | $170,000 | Gary Favro | |
| Swoboda Kern | -- | Kathleen Insley |
Source: Public Records
Mortgage History
| Date | Status | Borrower | Loan Amount |
|---|---|---|---|
| Open | Weslowski Lawrence | $99,200 |
Source: Public Records
Tax History
| Year | Tax Paid | Tax Assessment Tax Assessment Total Assessment is a certain percentage of the fair market value that is determined by local assessors to be the total taxable value of land and additions on the property. | Land | Improvement |
|---|---|---|---|---|
| 2024 | $6,676 | $248,600 | $31,000 | $217,600 |
| 2023 | $6,554 | $236,200 | $31,000 | $205,200 |
| 2022 | $6,165 | $214,700 | $31,000 | $183,700 |
| 2021 | $5,662 | $182,500 | $31,000 | $151,500 |
| 2020 | $5,599 | $182,500 | $31,000 | $151,500 |
| 2019 | $2,392 | $182,500 | $31,000 | $151,500 |
| 2018 | $5,218 | $164,800 | $26,500 | $138,300 |
| 2017 | $2,367 | $164,800 | $26,500 | $138,300 |
| 2016 | $4,996 | $164,800 | $26,500 | $138,300 |
| 2015 | -- | $164,800 | $26,500 | $138,300 |
| 2014 | -- | $164,800 | $26,500 | $138,300 |
Source: Public Records
Map
Nearby Homes
Your Personal Tour Guide
Ask me questions while you tour the home.