Estimated Value: $669,672 - $732,000
3
Beds
2
Baths
1,530
Sq Ft
$452/Sq Ft
Est. Value
About This Home
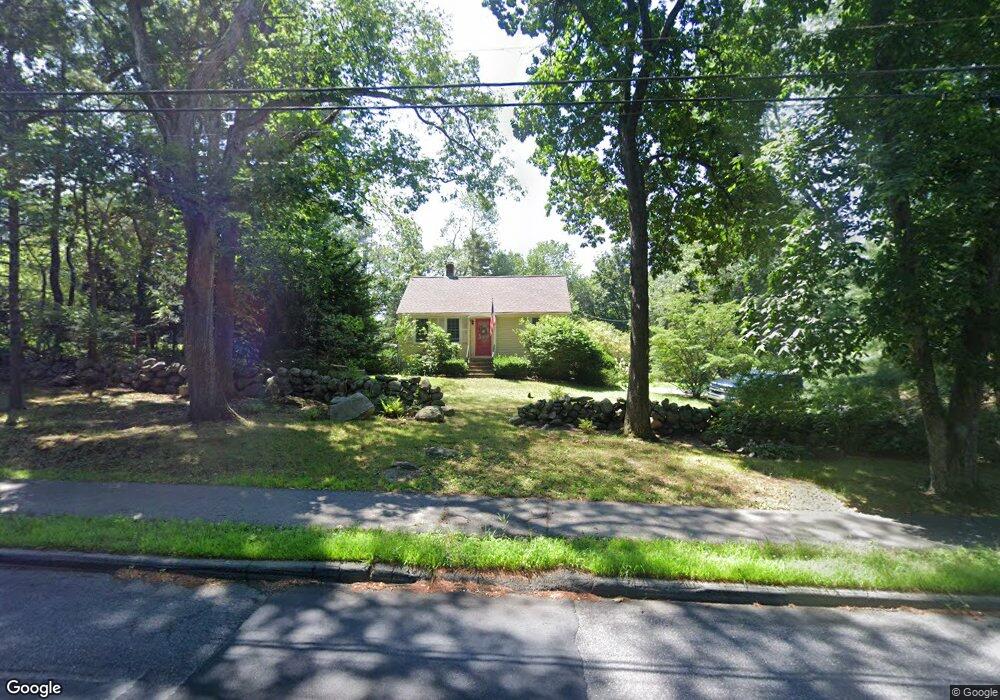
This home is located at 24 Hayward Rd, Acton, MA 01720 and is currently estimated at $691,418, approximately $451 per square foot. 24 Hayward Rd is a home located in Middlesex County with nearby schools including Acton-Boxborough Regional High School, Maynard Knowledge Beginnings, and The Imago School.
Ownership History
Date
Name
Owned For
Owner Type
Purchase Details
Closed on
Nov 7, 2024
Sold by
Williams Maureen F
Bought by
Mclaughlin & Williams Lt and Mclaughlin
Current Estimated Value
Purchase Details
Closed on
Dec 28, 2012
Sold by
Mclaughlin John F Est
Bought by
Mclaughlin-Williams M F
Create a Home Valuation Report for This Property
The Home Valuation Report is an in-depth analysis detailing your home's value as well as a comparison with similar homes in the area
Home Values in the Area
Average Home Value in this Area
Purchase History
We collect this data history from publicly available records. To have your information removed, we recommend requesting removal directly through your county’s website.
| Date | Buyer | Sale Price | Title Company |
|---|---|---|---|
| Mclaughlin & Williams Lt | -- | None Available | |
| Mclaughlin & Williams Lt | -- | None Available | |
| Mclaughlin-Williams M F | -- | -- | |
| Mclaughlin-Williams M F | -- | -- |
Source: Public Records
Mortgage History
We collect this data history from publicly available records. To have your information removed, we recommend requesting removal directly through your county’s website.
| Date | Status | Borrower | Loan Amount |
|---|---|---|---|
| Previous Owner | Mclaughlin-Williams M F | $150,000 | |
| Previous Owner | Mclaughlin-Williams M F | $50,000 | |
| Previous Owner | Mclaughlin-Williams M F | $49,999 |
Source: Public Records
Tax History
| Year | Tax Paid | Tax Assessment Tax Assessment Total Assessment is a certain percentage of the fair market value that is determined by local assessors to be the total taxable value of land and additions on the property. | Land | Improvement |
|---|---|---|---|---|
| 2025 | $9,916 | $578,200 | $288,800 | $289,400 |
| 2024 | $9,560 | $573,500 | $288,800 | $284,700 |
| 2023 | $9,611 | $547,300 | $262,600 | $284,700 |
| 2022 | $8,729 | $448,800 | $228,100 | $220,700 |
| 2021 | $8,434 | $416,900 | $211,400 | $205,500 |
| 2020 | $7,815 | $406,200 | $211,400 | $194,800 |
| 2019 | $7,657 | $395,300 | $211,400 | $183,900 |
| 2018 | $7,539 | $389,000 | $211,400 | $177,600 |
| 2017 | $7,414 | $389,000 | $211,400 | $177,600 |
| 2016 | $7,086 | $368,500 | $211,400 | $157,100 |
| 2015 | $6,450 | $338,600 | $211,400 | $127,200 |
| 2014 | $6,364 | $327,200 | $211,400 | $115,800 |
Source: Public Records
Map
Nearby Homes
- 4 Meadowbrook Rd
- 37 Concord Rd
- 491 Main St
- 103 Newtown Rd
- 14 Minot Ave
- 114 Nagog Hill Rd
- 34 Flint Rd
- 203 Main St
- 524 Main St
- 31 Elm St
- 23 Spruce St Unit B
- 70 River St
- 40 Mohawk Dr
- 220 Newtown Rd
- 320 Nagog Hill Rd
- 205 Great Rd Unit C-6
- 315 Nagog Hill Rd
- 92 Willow St Unit 1
- 12 Gabriel Ln
- 94 Willow St Unit 2
Your Personal Tour Guide
Ask me questions while you tour the home.