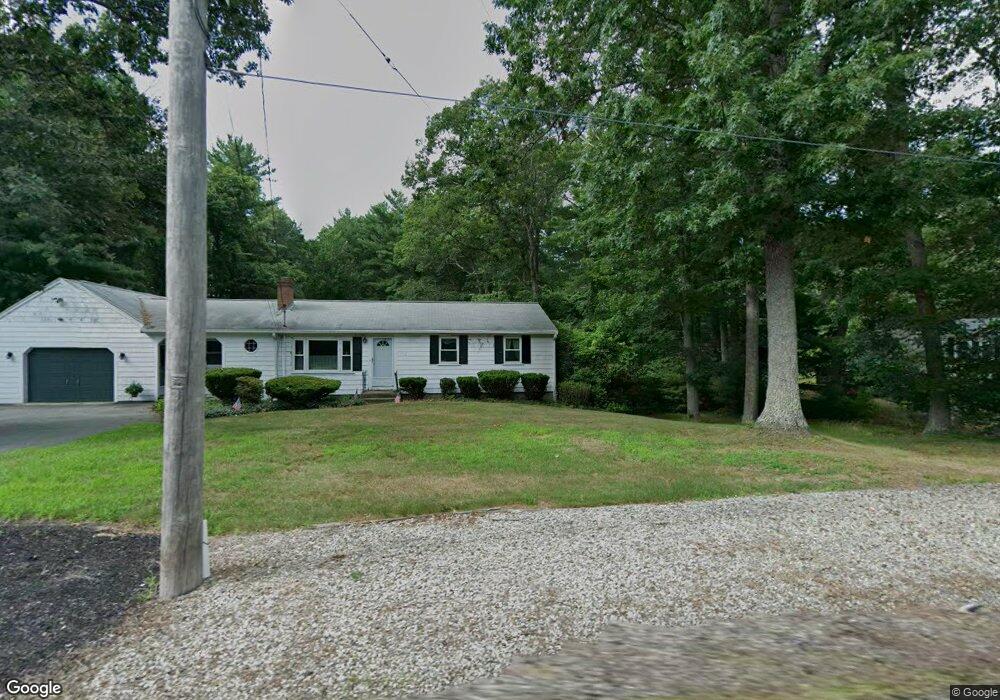
24 Plain St Pembroke, MA 02359
Estimated Value: $621,000 - $700,000
3
Beds
1
Bath
2,200
Sq Ft
$299/Sq Ft
Est. Value
About This Home
This home is located at 24 Plain St, Pembroke, MA 02359 and is currently estimated at $658,498, approximately $299 per square foot. 24 Plain St is a home located in Plymouth County with nearby schools including Pembroke High School.
Ownership History
Date
Name
Owned For
Owner Type
Purchase Details
Closed on
Jun 2, 2006
Sold by
Nugent Alice R
Bought by
Nugent John J and Hausmann Lisa A
Current Estimated Value
Purchase Details
Closed on
Nov 1, 2004
Sold by
Quin Michael O and Quin Debra M
Bought by
Nugent Alice R
Purchase Details
Closed on
May 22, 2001
Sold by
Claridge Corp
Bought by
Quin Michael O and Obrien Debra M
Create a Home Valuation Report for This Property
The Home Valuation Report is an in-depth analysis detailing your home's value as well as a comparison with similar homes in the area
Purchase History
| Date | Buyer | Sale Price | Title Company |
|---|---|---|---|
| Nugent John J | $330,000 | -- | |
| Nugent Alice R | $343,400 | -- | |
| Quin Michael O | $224,000 | -- |
Source: Public Records
Mortgage History
| Date | Status | Borrower | Loan Amount |
|---|---|---|---|
| Open | Quin Michael O | $271,000 | |
| Closed | Quin Michael O | $271,500 |
Source: Public Records
Tax History
| Year | Tax Paid | Tax Assessment Tax Assessment Total Assessment is a certain percentage of the fair market value that is determined by local assessors to be the total taxable value of land and additions on the property. | Land | Improvement |
|---|---|---|---|---|
| 2025 | $6,690 | $556,600 | $280,100 | $276,500 |
| 2024 | $6,604 | $549,000 | $275,300 | $273,700 |
| 2023 | $6,756 | $531,100 | $275,300 | $255,800 |
| 2022 | $6,222 | $439,700 | $225,300 | $214,400 |
| 2021 | $5,984 | $410,400 | $214,900 | $195,500 |
| 2020 | $5,808 | $400,800 | $205,300 | $195,500 |
| 2019 | $5,609 | $384,200 | $200,100 | $184,100 |
| 2018 | $5,253 | $352,800 | $185,300 | $167,500 |
| 2017 | $5,184 | $343,300 | $175,300 | $168,000 |
| 2016 | $5,074 | $332,500 | $165,300 | $167,200 |
| 2015 | $4,581 | $310,800 | $150,100 | $160,700 |
Source: Public Records
Map
Nearby Homes
- 26 Jessica Cir
- 627 School St
- 10 Mattakeesett Ave
- 100 Valley St
- 290 School St
- 10 Fir Rd
- 64 Copperwood Rd
- 0 Thompson St
- 25 Lawrence Rd
- 59 Erikson Ln
- 72 Old Cart Path Ln Unit Lot 2
- 78 Old Cart Path Ln Unit Lot 3
- 77 Old Cart Path Ln Unit Lot 4
- 143 Plymouth St
- 246 High St
- 7 Andrew Dr
- 14 Baltzer Dr
- 17 Oak St
- 561 Twin Lakes Dr
- 12 Herring Brook Ln
Your Personal Tour Guide
Ask me questions while you tour the home.