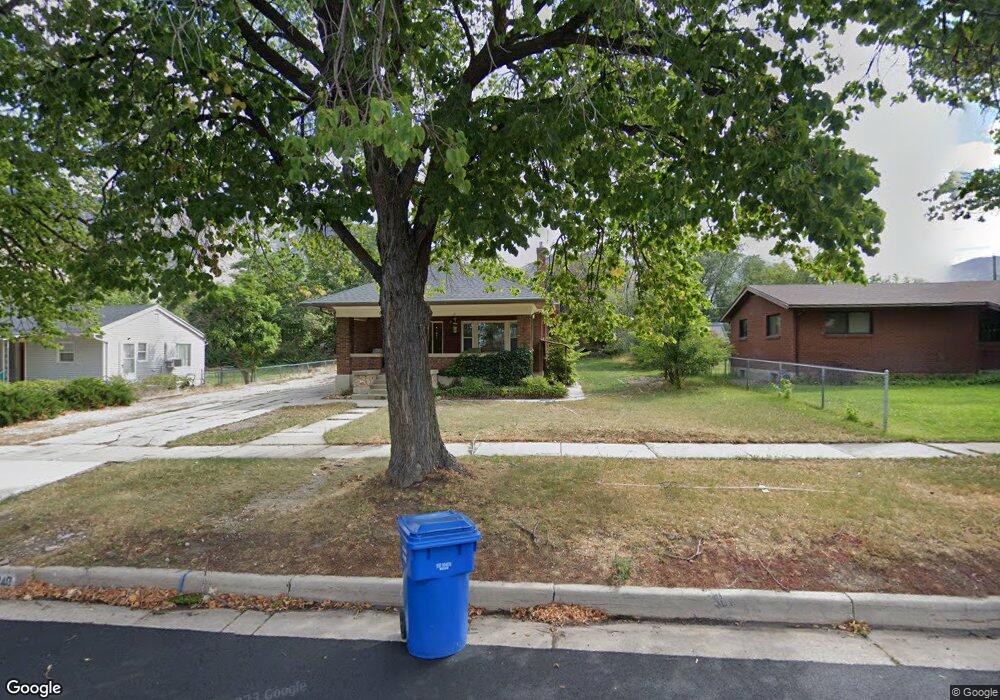
240 N 100 E Brigham City, UT 84302
Estimated Value: $375,000 - $398,955
Studio
--
Bath
1,218
Sq Ft
$318/Sq Ft
Est. Value
About This Home
This home is located at 240 N 100 E, Brigham City, UT 84302 and is currently estimated at $387,489, approximately $318 per square foot. 240 N 100 E is a home located in Box Elder County with nearby schools including Golden Spike Elementary, Box Elder Middle School, and Adele C. Young Intermediate School.
Ownership History
Date
Name
Owned For
Owner Type
Purchase Details
Closed on
Aug 29, 2005
Sold by
Stephensen Wayne C and Stephensen Shelby J
Bought by
Gustafson Richard D and Gustafson Janet L
Current Estimated Value
Home Financials for this Owner
Home Financials are based on the most recent Mortgage that was taken out on this home.
Original Mortgage
$92,000
Outstanding Balance
$48,755
Interest Rate
5.7%
Mortgage Type
New Conventional
Estimated Equity
$338,734
Create a Home Valuation Report for This Property
The Home Valuation Report is an in-depth analysis detailing your home's value as well as a comparison with similar homes in the area
Purchase History
| Date | Buyer | Sale Price | Title Company |
|---|---|---|---|
| Gustafson Richard D | -- | American Sercure Title |
Source: Public Records
Mortgage History
| Date | Status | Borrower | Loan Amount |
|---|---|---|---|
| Open | Gustafson Richard D | $92,000 |
Source: Public Records
Tax History
| Year | Tax Paid | Tax Assessment Tax Assessment Total Assessment is a certain percentage of the fair market value that is determined by local assessors to be the total taxable value of land and additions on the property. | Land | Improvement |
|---|---|---|---|---|
| 2025 | $2,265 | $389,462 | $105,000 | $284,462 |
| 2024 | $1,986 | $382,301 | $100,000 | $282,301 |
| 2023 | $2,070 | $408,061 | $95,000 | $313,061 |
| 2022 | $2,098 | $211,463 | $22,000 | $189,463 |
| 2021 | $1,601 | $221,118 | $40,000 | $181,118 |
| 2020 | $1,361 | $221,118 | $40,000 | $181,118 |
| 2019 | $1,274 | $110,155 | $22,000 | $88,155 |
| 2018 | $1,148 | $98,656 | $22,000 | $76,656 |
| 2017 | $1,085 | $131,400 | $0 | $131,400 |
| 2016 | $1,134 | $85,329 | $16,500 | $68,829 |
| 2015 | $1,050 | $79,071 | $16,500 | $62,571 |
| 2014 | $1,050 | $76,092 | $16,500 | $59,592 |
| 2013 | -- | $76,092 | $16,500 | $59,592 |
Source: Public Records
Map
Nearby Homes
Your Personal Tour Guide
Ask me questions while you tour the home.