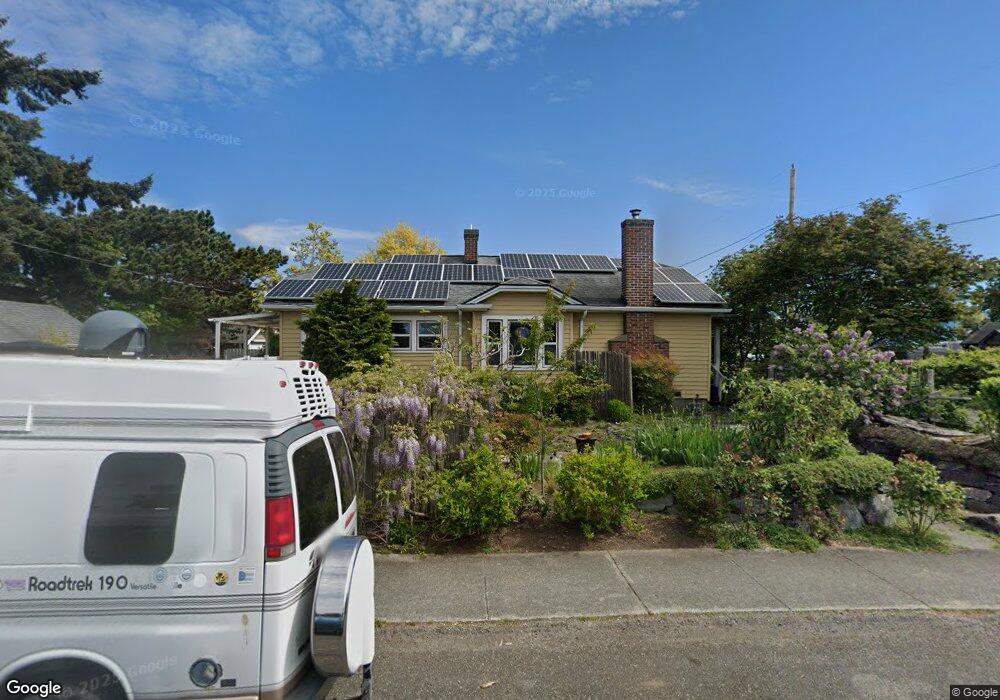
2401 E St Bellingham, WA 98225
Lettered Streets NeighborhoodEstimated Value: $578,000 - $662,761
3
Beds
3
Baths
1,020
Sq Ft
$628/Sq Ft
Est. Value
About This Home
This home is located at 2401 E St, Bellingham, WA 98225 and is currently estimated at $640,440, approximately $627 per square foot. 2401 E St is a home located in Whatcom County with nearby schools including Parkview Elementary School, Whatcom Middle School, and Bellingham High School.
Ownership History
Date
Name
Owned For
Owner Type
Purchase Details
Closed on
Sep 20, 2022
Sold by
Jager Duane B and Jager Christine B
Bought by
Jager Duane and Gibbs Christine B
Current Estimated Value
Purchase Details
Closed on
Sep 17, 2002
Sold by
Scheib Mark A and Pierce Kris M
Bought by
Jager Duane
Home Financials for this Owner
Home Financials are based on the most recent Mortgage that was taken out on this home.
Original Mortgage
$106,400
Interest Rate
6.24%
Purchase Details
Closed on
May 7, 2002
Sold by
Scheib Mark A
Bought by
Scheib Mark A and Pierce Kris M
Create a Home Valuation Report for This Property
The Home Valuation Report is an in-depth analysis detailing your home's value as well as a comparison with similar homes in the area
Home Values in the Area
Average Home Value in this Area
Purchase History
| Date | Buyer | Sale Price | Title Company |
|---|---|---|---|
| Jager Duane | -- | -- | |
| Jager Duane | -- | Chicago Title Insurance | |
| Scheib Mark A | -- | Chicago Title Insurance Comp |
Source: Public Records
Mortgage History
| Date | Status | Borrower | Loan Amount |
|---|---|---|---|
| Previous Owner | Jager Duane | $106,400 |
Source: Public Records
Tax History
| Year | Tax Paid | Tax Assessment Tax Assessment Total Assessment is a certain percentage of the fair market value that is determined by local assessors to be the total taxable value of land and additions on the property. | Land | Improvement |
|---|---|---|---|---|
| 2025 | $4,993 | $628,213 | $253,696 | $374,517 |
| 2024 | $4,868 | $609,909 | $246,304 | $363,605 |
| 2023 | $4,868 | $625,400 | $252,560 | $372,840 |
| 2022 | $3,975 | $539,148 | $217,728 | $321,420 |
| 2021 | $3,899 | $427,895 | $172,800 | $255,095 |
| 2020 | $3,911 | $396,199 | $160,000 | $236,199 |
| 2019 | $3,501 | $384,082 | $141,415 | $242,667 |
| 2018 | $3,526 | $344,765 | $126,965 | $217,800 |
| 2017 | $3,042 | $296,832 | $109,310 | $187,522 |
| 2016 | $2,661 | $267,620 | $98,090 | $169,530 |
| 2015 | $2,609 | $243,762 | $89,590 | $154,172 |
| 2014 | -- | $231,273 | $85,000 | $146,273 |
| 2013 | -- | $220,170 | $73,500 | $146,670 |
Source: Public Records
Map
Nearby Homes
Your Personal Tour Guide
Ask me questions while you tour the home.