2405 S 700 E Marion, IN 46953
Marion AreaEstimated Value: $273,903 - $372,000
About This Home
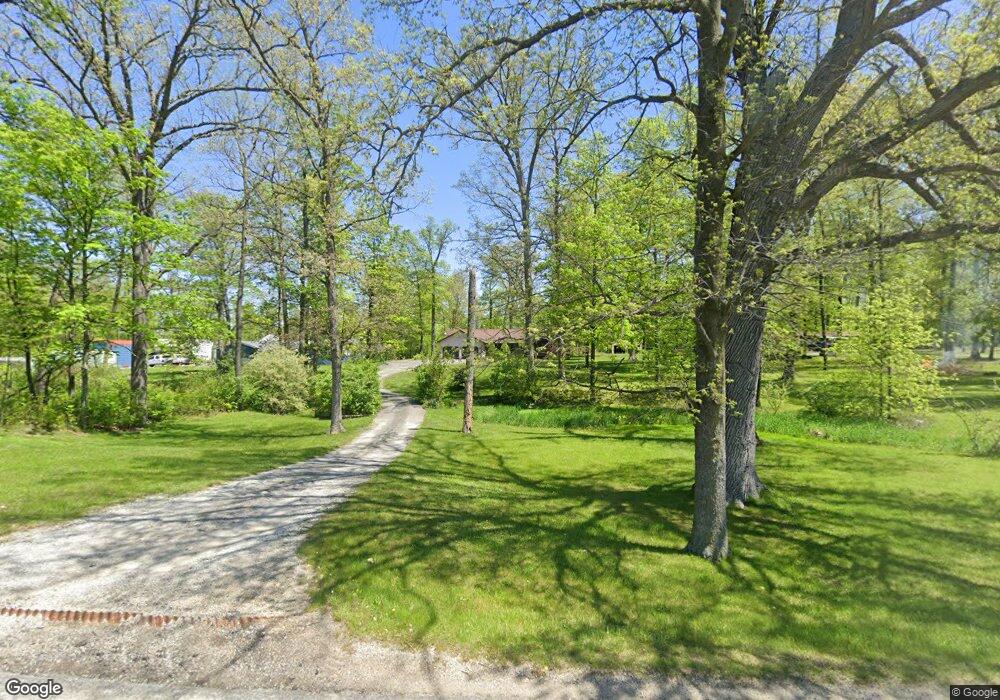
This home is located at 2405 S 700 E, Marion, IN 46953 and is currently estimated at $313,726, approximately $151 per square foot. 2405 S 700 E is a home located in Grant County.
Ownership History
We collect this data history from publicly available records. To have your information removed, we recommend requesting removal directly through your county’s website.
Purchase Details
Home Financials for this Owner
Home Financials are based on the most recent Mortgage that was taken out on this home.Purchase Details
Home Financials for this Owner
Home Financials are based on the most recent Mortgage that was taken out on this home.Purchase History
We collect this data history from publicly available records. To have your information removed, we recommend requesting removal directly through your county’s website.
| Date | Buyer | Sale Price | Title Company |
|---|---|---|---|
| -- | None Available | ||
| -- | None Available |
Mortgage History
We collect this data history from publicly available records. To have your information removed, we recommend requesting removal directly through your county’s website.
| Date | Status | Borrower | Loan Amount |
|---|---|---|---|
| Open | $99,900 |
Tax History
We collect this data history from publicly available records. To have your information removed, we recommend requesting removal directly through your county’s website.
| Year | Tax Paid | Tax Assessment Tax Assessment Total Assessment is a certain percentage of the fair market value that is determined by local assessors to be the total taxable value of land and additions on the property. | Land | Improvement |
|---|---|---|---|---|
| 2025 | $1,407 | $259,000 | $21,900 | $237,100 |
| 2024 | $1,329 | $232,600 | $21,900 | $210,700 |
| 2023 | $1,282 | $212,800 | $21,900 | $190,900 |
| 2022 | $1,279 | $195,500 | $17,100 | $178,400 |
| 2021 | $1,169 | $179,600 | $17,100 | $162,500 |
| 2020 | $1,046 | $174,300 | $16,200 | $158,100 |
| 2019 | $919 | $165,600 | $16,200 | $149,400 |
| 2018 | $806 | $156,000 | $12,800 | $143,200 |
| 2017 | $749 | $155,000 | $12,800 | $142,200 |
| 2016 | $709 | $155,000 | $12,800 | $142,200 |
| 2014 | $590 | $139,100 | $12,800 | $126,300 |
| 2013 | $590 | $144,900 | $12,800 | $132,100 |
Map
- 0 E 200 S Unit 202601439
- 6004 E 200 S
- 1270 S 600 E
- 300 E S
- 201 Cypress Ct
- 8849 E 100 S
- 215 S 600 E
- 4432 E 200 S
- 5556 Montpelier Pike
- 277 S 500 E
- 5950 E 500 S
- 0 County Road 425 S
- 3641 S 1000 E
- 66 Cobblestone Blvd
- 2 Walden Dr
- Lot 9 W South St
- Lot 7 W South St
- Lot 8 W South St
- 171 S Main St
- 154 N Half St
Ask me questions while you tour the home.