C
Landlord's Agent in 2024
Chyada Dennis
Main Street Renewal LLC
Estimated Value: $258,302 - $287,000
Open Listing attachment for more information
Last Agent to Rent the Property
Chyada Dennis
Main Street Renewal LLC License #3373202 Listed on: 10/05/2023
Last Renter's Agent
Spencer Lindahl
Main Street Renewal LLC License #3271439
We collect this data history from publicly available records. To have your information removed, we recommend requesting removal directly through your county’s website.
We collect this data history from publicly available records. To have your information removed, we recommend requesting removal directly through your county’s website.
| Date | Buyer | Sale Price | Title Company |
|---|---|---|---|
| $26,500 | Bchh Inc | ||
| $25,600 | None Available | ||
| $100,000 | Attorney | ||
| -- | -- |
We collect this data history from publicly available records. To have your information removed, we recommend requesting removal directly through your county’s website.
| Date | Status | Borrower | Loan Amount |
|---|---|---|---|
| Previous Owner | $38,600 |
We collect this data history from publicly available records. To have your information removed, we recommend requesting removal directly through your county’s website.
| Date | Event | Price | List to Sale | Price per Sq Ft | Prior Sale |
|---|---|---|---|---|---|
| 01/20/2024 01/20/24 | Rented | $1,720 | -11.6% | -- | |
| 01/19/2024 01/19/24 | Under Contract | -- | -- | -- | |
| 10/05/2023 10/05/23 | For Rent | $1,945 | 0.0% | -- | |
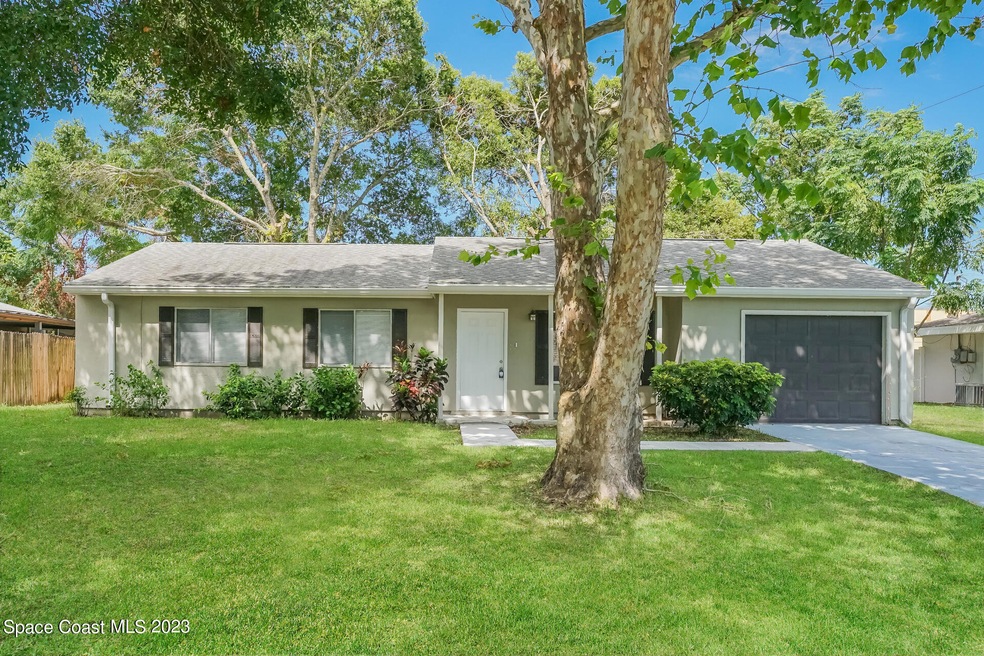
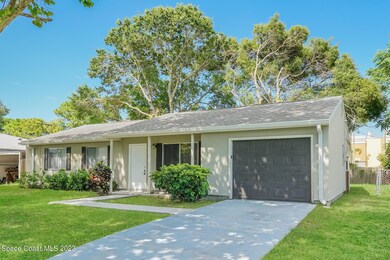
| 05/19/2022 05/19/22 | Sold | $260,500 | +4.2% | $222 / Sq Ft | View Prior Sale |
| 03/11/2022 03/11/22 | Pending | -- | -- | -- | |
| 03/08/2022 03/08/22 | For Sale | $250,000 | 0.0% | $213 / Sq Ft | |
| 04/03/2020 04/03/20 | Rented | $1,250 | -7.4% | -- | |
| 02/29/2020 02/29/20 | Under Contract | -- | -- | -- | |
| 12/19/2019 12/19/19 | For Rent | $1,350 | 0.0% | -- | |
| 12/12/2019 12/12/19 | Under Contract | -- | -- | -- | |
| 12/10/2019 12/10/19 | For Rent | $1,350 | +3.8% | -- | |
| 05/24/2019 05/24/19 | Rented | $1,300 | 0.0% | -- | |
| 05/03/2019 05/03/19 | Under Contract | -- | -- | -- | |
| 05/02/2019 05/02/19 | For Rent | $1,300 | -- | -- |
We collect this data history from publicly available records. To have your information removed, we recommend requesting removal directly through your county’s website.
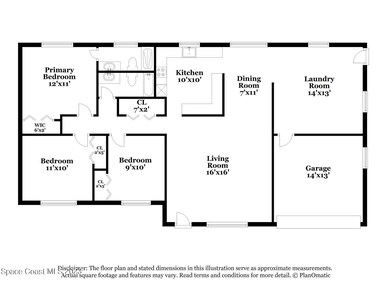
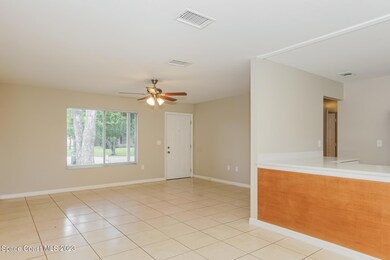
| Year | Tax Paid | Tax Assessment Tax Assessment Total Assessment is a certain percentage of the fair market value that is determined by local assessors to be the total taxable value of land and additions on the property. | Land | Improvement |
|---|---|---|---|---|
| 2025 | $3,470 | $229,880 | -- | -- |
| 2024 | $3,408 | $231,790 | -- | -- |
| 2023 | $3,408 | $222,380 | $56,000 | $166,380 |
| 2022 | $2,736 | $194,210 | $0 | $0 |
| 2021 | $1,986 | $148,020 | $42,000 | $106,020 |
| 2020 | $2,357 | $137,190 | $40,000 | $97,190 |
| 2019 | $2,285 | $131,690 | $35,000 | $96,690 |
| 2018 | $2,202 | $122,400 | $27,000 | $95,400 |
| 2017 | $1,524 | $86,510 | $24,000 | $62,510 |
| 2016 | $1,396 | $68,860 | $18,000 | $50,860 |
| 2015 | $1,326 | $52,750 | $15,000 | $37,750 |
| 2014 | $1,216 | $47,960 | $11,000 | $36,960 |
C
Landlord's Agent in 2024
Chyada Dennis
Main Street Renewal LLC
S
Tenant's Agent in 2024
Spencer Lindahl
Main Street Renewal LLC
S
Seller's Agent in 2022
Sascha Davis
EXP Realty, LLC
L
Seller's Agent in 2020
Liz Cooper Vanneste
RE/MAX
(321) 890-9972
1 in this area
20 Total Sales
M
Buyer's Agent in 2020
Michael Tobi
Blue Marlin Real Estate

Buyer's Agent in 2019
Jack Maggard
RE/MAX
(321) 302-1310
2 in this area
40 Total Sales
Source: Space Coast MLS (Space Coast Association of REALTORS®)
MLS Number: 976952
APN: 23-35-13-02-00029.0-0009.00
Disclaimer: Certain information contained herein is derived from information provided by parties other than Homes.com. All information provided is deemed reliable, but is not guaranteed to be accurate and should be independently verified.
![]() IDX information is provided exclusively for personal, non-commercial use, and may not be used for any purpose other than to identify prospective properties consumers may be interested in purchasing.
IDX information is provided exclusively for personal, non-commercial use, and may not be used for any purpose other than to identify prospective properties consumers may be interested in purchasing.
Information is deemed reliable but not guaranteed.
Ask me questions while you tour the home.