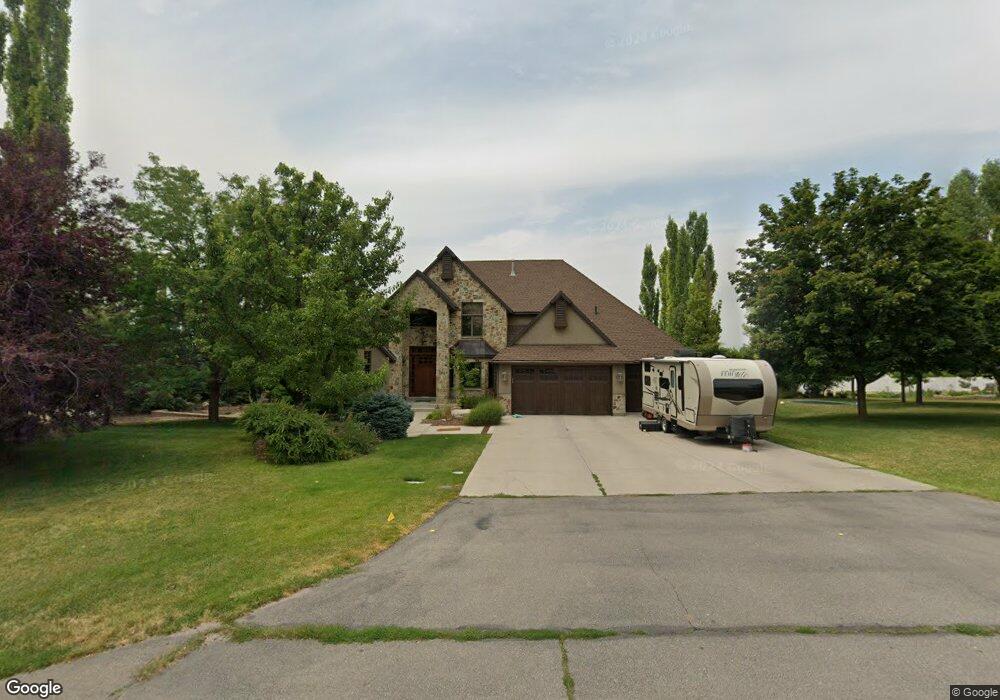
241 N 1000 E Hyde Park, UT 84318
Estimated Value: $1,043,415 - $1,286,000
Studio
--
Bath
3,416
Sq Ft
$347/Sq Ft
Est. Value
About This Home
This home is located at 241 N 1000 E, Hyde Park, UT 84318 and is currently estimated at $1,186,472, approximately $347 per square foot. 241 N 1000 E is a home with nearby schools including North Park School, Cedar Ridge School, and North Cache Middle School.
Ownership History
Date
Name
Owned For
Owner Type
Purchase Details
Closed on
Jul 27, 2022
Sold by
Olsen Dylan J and Olsen Katie E
Bought by
Dylan And Katie Olsen Revocable Trust and Olsen
Current Estimated Value
Purchase Details
Closed on
May 2, 2022
Sold by
Jay Dee Barr And Machelle Barr Revocable and Barr Jay Dee
Bought by
Olsen Dylan J and Olsen Katie E
Home Financials for this Owner
Home Financials are based on the most recent Mortgage that was taken out on this home.
Original Mortgage
$1,000,000
Interest Rate
4.42%
Mortgage Type
New Conventional
Purchase Details
Closed on
Oct 1, 2021
Sold by
Barr Jaydee and Barr Machelle
Bought by
Jay Dee Barr And Machelle Barr Revocable Trus and Barr
Home Financials for this Owner
Home Financials are based on the most recent Mortgage that was taken out on this home.
Original Mortgage
$530,000
Interest Rate
2.1%
Mortgage Type
New Conventional
Purchase Details
Closed on
Jan 3, 2013
Sold by
Barr Jay Dee and Barr Machelle
Bought by
Barr Jay Dee and Barr Machelle
Home Financials for this Owner
Home Financials are based on the most recent Mortgage that was taken out on this home.
Original Mortgage
$142,350
Interest Rate
3.27%
Mortgage Type
New Conventional
Create a Home Valuation Report for This Property
The Home Valuation Report is an in-depth analysis detailing your home's value as well as a comparison with similar homes in the area
Home Values in the Area
Average Home Value in this Area
Purchase History
| Date | Buyer | Sale Price | Title Company |
|---|---|---|---|
| Dylan And Katie Olsen Revocable Trust | -- | Cache Title | |
| Dylan And Katie Olsen Revocable Trust | -- | Cache Title | |
| Olsen Dylan J | -- | Pinnacle Title | |
| Olsen Dylan J | -- | Pinnacle Title | |
| Jay Dee Barr And Machelle Barr Revocable Trus | -- | Pinnacle Title | |
| Jay Dee Barr And Machelle Barr Revocable Trus | -- | Pinnacle Title | |
| Barr Jaydee | -- | Pinnacle Title | |
| Barr Jaydee | -- | Pinnacle Title | |
| Barr Jay Dee | -- | Pinnacle Title Ins Agency | |
| Barr Jay Dee | -- | Pinnacle Title Ins Agency |
Source: Public Records
Mortgage History
| Date | Status | Borrower | Loan Amount |
|---|---|---|---|
| Previous Owner | Olsen Dylan J | $1,000,000 | |
| Previous Owner | Barr Jaydee | $530,000 | |
| Previous Owner | Barr Jay Dee | $142,350 |
Source: Public Records
Tax History
| Year | Tax Paid | Tax Assessment Tax Assessment Total Assessment is a certain percentage of the fair market value that is determined by local assessors to be the total taxable value of land and additions on the property. | Land | Improvement |
|---|---|---|---|---|
| 2025 | $4,486 | $618,465 | $0 | $0 |
| 2024 | $5,995 | $762,150 | $0 | $0 |
| 2023 | $6,247 | $755,425 | $0 | $0 |
| 2022 | $6,497 | $755,425 | $0 | $0 |
| 2021 | $6,137 | $1,120,800 | $110,000 | $1,010,800 |
| 2020 | $4,180 | $726,060 | $110,000 | $616,060 |
| 2019 | $4,404 | $726,059 | $110,000 | $616,059 |
| 2018 | $3,871 | $625,704 | $90,000 | $535,704 |
| 2017 | $3,976 | $338,360 | $0 | $0 |
| 2016 | $4,034 | $338,360 | $0 | $0 |
| 2015 | $3,701 | $313,730 | $0 | $0 |
| 2014 | $3,606 | $313,730 | $0 | $0 |
| 2013 | -- | $313,730 | $0 | $0 |
Source: Public Records
Map
Nearby Homes
- 940 E Canyon Rd
- 898 E 260 N
- 803 E 160 N Unit 1
- 882 E 160 N Unit 4
- 120 N 900 E
- 866 E 130 N
- 355 N 1100 E
- 894 E 130 N Unit 17
- 1153 E 160 N
- 108 N 900 E
- 1154 E 160 N
- 444 N 890 E
- 444 N 890 E Unit 179
- 1128 E 50 N Unit 81
- 124 N 1140 E
- 1087 E 160 N
- 116 N 820 E
- 458 W Madison St S
- 1130 E 245 N
- 201 N 1000 E Unit 19
Your Personal Tour Guide
Ask me questions while you tour the home.