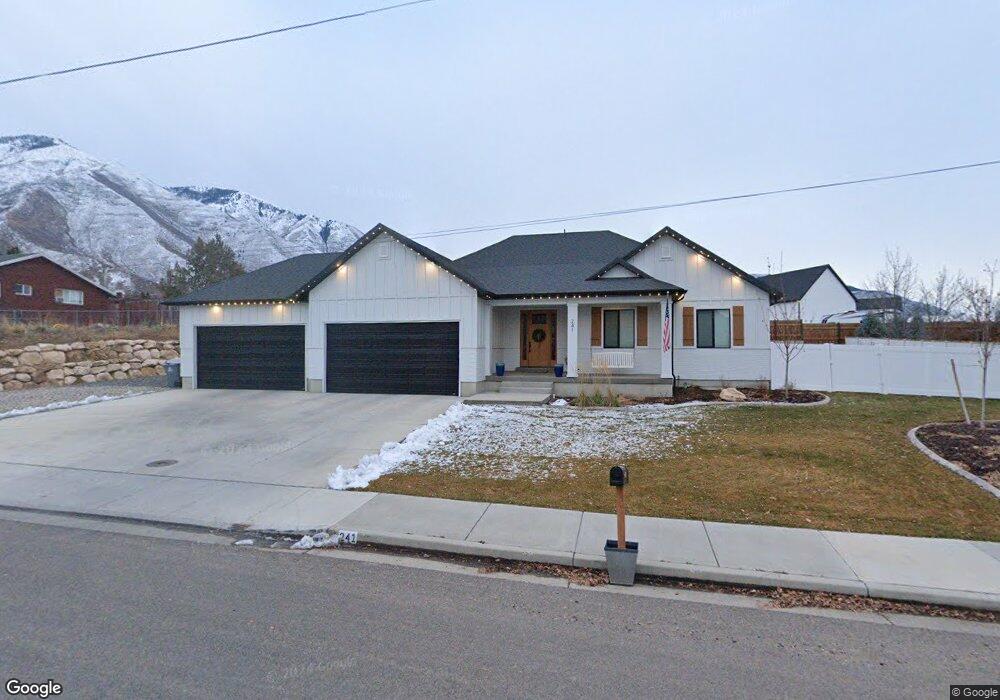
241 W 1600 S Mapleton, UT 84664
Estimated Value: $791,000 - $1,043,533
4
Beds
2
Baths
3,974
Sq Ft
$238/Sq Ft
Est. Value
About This Home
This home is located at 241 W 1600 S, Mapleton, UT 84664 and is currently estimated at $947,633, approximately $238 per square foot. 241 W 1600 S is a home located in Utah County with nearby schools including Maple Ridge Elementary, Mapleton Junior High School, and Maple Mountain High School.
Ownership History
Date
Name
Owned For
Owner Type
Purchase Details
Closed on
Oct 19, 2022
Sold by
Marvel Home Builders Llc
Bought by
Winn Tyler Wallace
Current Estimated Value
Home Financials for this Owner
Home Financials are based on the most recent Mortgage that was taken out on this home.
Original Mortgage
$525,000
Outstanding Balance
$507,410
Interest Rate
6.7%
Mortgage Type
Balloon
Estimated Equity
$440,223
Purchase Details
Closed on
Jul 14, 2021
Sold by
Perrero Bret and Peterson Angl
Bought by
Marvel Home Builders Llc
Purchase Details
Closed on
May 12, 2021
Sold by
Keymaster Investments Llc
Bought by
Perrero Bret and Perrero Angi
Purchase Details
Closed on
May 10, 2018
Sold by
Apex Invetmnts Group Llc
Bought by
Keymaster Invtemnts Llc
Create a Home Valuation Report for This Property
The Home Valuation Report is an in-depth analysis detailing your home's value as well as a comparison with similar homes in the area
Home Values in the Area
Average Home Value in this Area
Purchase History
| Date | Buyer | Sale Price | Title Company |
|---|---|---|---|
| Winn Tyler Wallace | -- | Key Land Title | |
| Marvel Home Builders Llc | -- | Key Land Title | |
| Perrero Bret | -- | First American | |
| Keymaster Invtemnts Llc | -- | Stewart Title Ins |
Source: Public Records
Mortgage History
| Date | Status | Borrower | Loan Amount |
|---|---|---|---|
| Open | Winn Tyler Wallace | $525,000 |
Source: Public Records
Tax History
| Year | Tax Paid | Tax Assessment Tax Assessment Total Assessment is a certain percentage of the fair market value that is determined by local assessors to be the total taxable value of land and additions on the property. | Land | Improvement |
|---|---|---|---|---|
| 2025 | $3,894 | $411,235 | -- | -- |
| 2024 | $3,894 | $381,425 | $0 | $0 |
| 2023 | $3,944 | $388,850 | $0 | $0 |
| 2022 | $3,165 | $308,500 | $308,500 | $0 |
| 2021 | $2,418 | $199,000 | $199,000 | $0 |
| 2020 | $2,212 | $176,100 | $176,100 | $0 |
| 2019 | $2,167 | $176,100 | $176,100 | $0 |
| 2018 | $1,939 | $161,800 | $161,800 | $0 |
| 2017 | $2,008 | $149,900 | $0 | $0 |
| 2016 | $1,755 | $130,200 | $0 | $0 |
| 2015 | $1,551 | $114,400 | $0 | $0 |
| 2014 | $1,503 | $108,900 | $0 | $0 |
Source: Public Records
Map
Nearby Homes
- 2057 E Maple Hills Ln
- 550 N 2000 E
- 4727 S 690 W Unit W101
- 2116 S Valley View Dr Unit 58
- 737 N 1970 W Unit 347
- 2056 E Maple Hills Ln
- 3635 S Riverstone Rd E Unit 81
- 3755 S Mapleton Estates Dr E Unit 75
- 1378 E 1435 N Unit 7
- 3583 S Mapleton Dr Unit 13
- 1354 S 800 E
- 2771 W Aurora Ave S
- 567 N Legend Way Unit A/468
- 278 E Maple Ridge Rd S Unit 46
- 1352 E 1435 N Unit 6
- 2700 S Main St
- 525 N 1550 W Unit COLUMB
- 525 N 1550 W Unit WINDSO
- 525 N 1550 W Unit HILDAL
- 525 N 1550 W Unit BALLAR
- 241 W 1600 S Unit 10
- 275 W 1600 S
- 149 W 1600 S
- 1708 Hillcrest Cir
- 1708 Hillcrest Cir Unit 9
- 140 W 1600 S
- 1720 Hillcrest Cir
- 1720 Hillcrest Cir Unit 8
- 1720 Hillcrest Cir Unit 4
- 1727 Hillcrest Cir Unit 11
- 85 W 1600 S
- 370 W 1600 S
- 1758 Hillcrest Cir
- 1758 Hillcrest Cir Unit 7
- 395 W 1600 S
- 1767 Hillcrest Cir Unit 12
- 1767 Hillcrest Cir
- 390 W 1600 S
- 390 W 800 S
- 435 W 1600 S
Your Personal Tour Guide
Ask me questions while you tour the home.