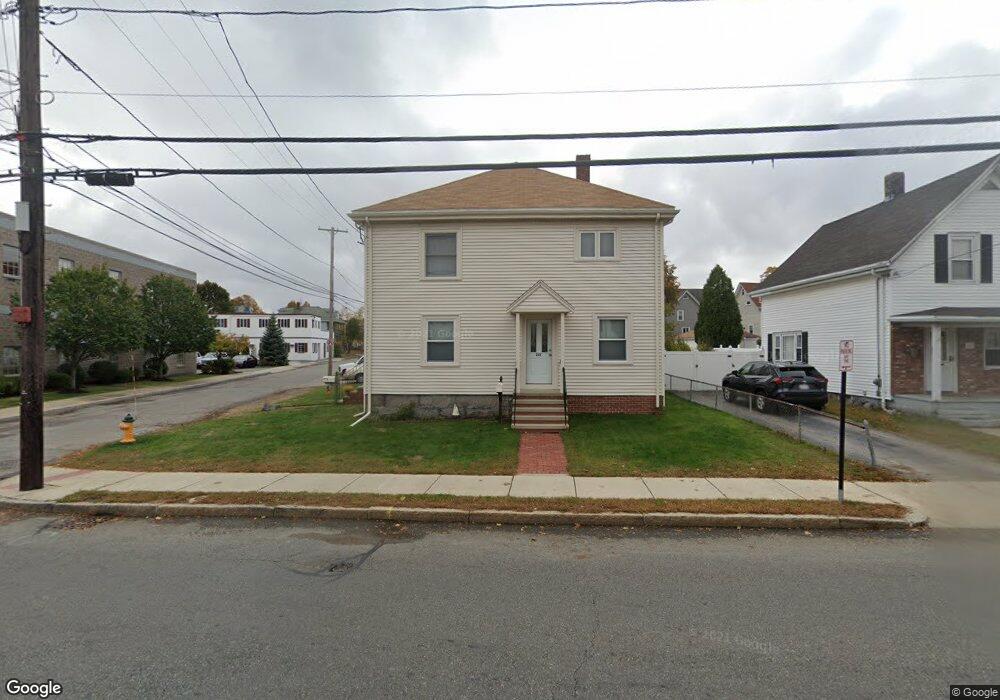
243 Centre St Quincy, MA 02169
South Quincy NeighborhoodEstimated Value: $800,961 - $1,011,000
4
Beds
2
Baths
2,170
Sq Ft
$421/Sq Ft
Est. Value
About This Home
This home is located at 243 Centre St, Quincy, MA 02169 and is currently estimated at $913,240, approximately $420 per square foot. 243 Centre St is a home located in Norfolk County with nearby schools including South West Middle School, Lincoln-Hancock Community School, and Quincy High School.
Ownership History
Date
Name
Owned For
Owner Type
Purchase Details
Closed on
Nov 3, 2004
Sold by
Salvatore Richard
Bought by
Salvatore Kathy and Salvatore Richard
Current Estimated Value
Home Financials for this Owner
Home Financials are based on the most recent Mortgage that was taken out on this home.
Original Mortgage
$160,000
Outstanding Balance
$79,473
Interest Rate
5.71%
Mortgage Type
Purchase Money Mortgage
Estimated Equity
$833,767
Create a Home Valuation Report for This Property
The Home Valuation Report is an in-depth analysis detailing your home's value as well as a comparison with similar homes in the area
Home Values in the Area
Average Home Value in this Area
Purchase History
| Date | Buyer | Sale Price | Title Company |
|---|---|---|---|
| Salvatore Kathy | -- | -- |
Source: Public Records
Mortgage History
| Date | Status | Borrower | Loan Amount |
|---|---|---|---|
| Open | Salvatore Kathy | $160,000 |
Source: Public Records
Tax History
| Year | Tax Paid | Tax Assessment Tax Assessment Total Assessment is a certain percentage of the fair market value that is determined by local assessors to be the total taxable value of land and additions on the property. | Land | Improvement |
|---|---|---|---|---|
| 2025 | $8,980 | $778,800 | $285,000 | $493,800 |
| 2024 | $8,460 | $750,700 | $271,500 | $479,200 |
| 2023 | $7,919 | $711,500 | $246,800 | $464,700 |
| 2022 | $7,634 | $637,200 | $205,700 | $431,500 |
| 2021 | $7,766 | $639,700 | $205,700 | $434,000 |
| 2020 | $7,700 | $619,500 | $205,700 | $413,800 |
| 2019 | $7,337 | $584,600 | $194,000 | $390,600 |
| 2018 | $6,895 | $516,900 | $179,700 | $337,200 |
| 2017 | $6,956 | $490,900 | $171,100 | $319,800 |
| 2016 | $6,198 | $431,600 | $148,800 | $282,800 |
| 2015 | $6,097 | $417,600 | $148,800 | $268,800 |
| 2014 | $5,335 | $359,000 | $148,800 | $210,200 |
Source: Public Records
Map
Nearby Homes
- 51 Branch St Unit 3
- 87 Village Dr
- 21 Totman St Unit 205
- 21 Totman St Unit 409
- 21 Totman St Unit 203
- 21 Totman St Unit 403
- 21 Totman St Unit 301
- 21 Totman St Unit 208
- 21 Totman St Unit PH-401
- 21 Totman St Unit 204
- 79 Gilbert St
- 132 Centre St
- 9 Westford St
- 56 Penn St Unit 4
- 91 Garfield St
- 21 Arthur St
- 84 West St Unit 1
- 156 West St
- 99 Verchild St
- 8 Jackson St Unit B1
- 241 Centre St
- 11 Branch St
- 253 Centre St
- 233 Centre St
- 12 Albertina St
- 120 Brooks Ave
- 254 Centre St
- 16 Albertina St
- 16 Albertina St Unit 16
- 19 Branch St
- 17 Branch St Unit 19
- 114 Brooks Ave
- 22 Albertina St
- 20A Branch St
- 20 Branch St
- 11 Vernon St
- 9 Vernon St
- 229 Centre St
- 229 Centre St Unit 1
- 229 Centre St Unit 3
Your Personal Tour Guide
Ask me questions while you tour the home.