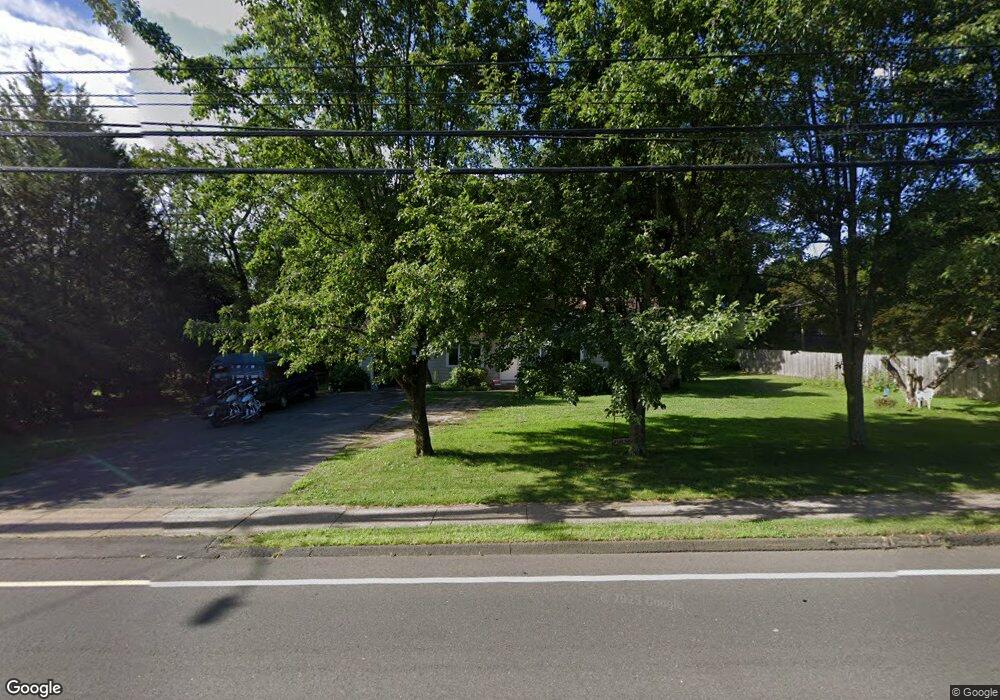
243 Elm St Windsor Locks, CT 06096
Estimated Value: $304,000 - $344,759
3
Beds
3
Baths
1,279
Sq Ft
$257/Sq Ft
Est. Value
About This Home
This home is located at 243 Elm St, Windsor Locks, CT 06096 and is currently estimated at $328,690, approximately $256 per square foot. 243 Elm St is a home located in Hartford County with nearby schools including North Street School, South Elementary School, and Windsor Locks Middle School.
Ownership History
Date
Name
Owned For
Owner Type
Purchase Details
Closed on
Jun 11, 2018
Sold by
Acravello Nichole
Bought by
Wells Fargo Bank Na
Current Estimated Value
Purchase Details
Closed on
Oct 14, 1998
Sold by
Bogart Barbara
Bought by
Seaha John
Create a Home Valuation Report for This Property
The Home Valuation Report is an in-depth analysis detailing your home's value as well as a comparison with similar homes in the area
Home Values in the Area
Average Home Value in this Area
Purchase History
| Date | Buyer | Sale Price | Title Company |
|---|---|---|---|
| Wells Fargo Bank Na | $109,200 | -- | |
| Seaha John | $107,000 | -- | |
| Wells Fargo Bank Na | $109,200 | -- | |
| Seaha John | $107,000 | -- |
Source: Public Records
Mortgage History
| Date | Status | Borrower | Loan Amount |
|---|---|---|---|
| Previous Owner | Seaha John | $25,000 | |
| Previous Owner | Seaha John | $21,500 | |
| Previous Owner | Seaha John | $66,000 |
Source: Public Records
Tax History
| Year | Tax Paid | Tax Assessment Tax Assessment Total Assessment is a certain percentage of the fair market value that is determined by local assessors to be the total taxable value of land and additions on the property. | Land | Improvement |
|---|---|---|---|---|
| 2025 | $5,736 | $239,120 | $69,580 | $169,540 |
| 2024 | $4,131 | $146,790 | $60,690 | $86,100 |
| 2023 | $3,865 | $146,790 | $60,690 | $86,100 |
| 2022 | $3,792 | $146,790 | $60,690 | $86,100 |
| 2021 | $3,792 | $146,790 | $60,690 | $86,100 |
| 2020 | $3,792 | $146,790 | $60,690 | $86,100 |
| 2019 | $3,792 | $146,790 | $60,690 | $86,100 |
| 2017 | $3,442 | $129,100 | $51,900 | $77,200 |
| 2016 | $3,442 | $129,100 | $51,900 | $77,200 |
| 2015 | $3,459 | $129,100 | $51,900 | $77,200 |
| 2014 | $4,060 | $154,800 | $58,100 | $96,700 |
Source: Public Records
Map
Nearby Homes
- 13 Jubrey Ln
- 102 Orchard Hill Dr
- 59 Elm St
- 24 Coolidge St
- 4 Woodland Hollow St
- 202 Reed Ave
- 404 Woodland St
- 80 West St
- 10 Dibble Hollow Ln Unit 10
- 34 Cornwall Dr
- 32 Walnut Cir
- 13 Quail Ct
- 24 Bel-Aire Cir
- 15 Suffield St
- 13 Pine Dr
- 140 S Water St
- 29 Dean Ave
- 19 Dean Ave
- 3 Concorde Way Unit B1
- 0 N Water St Unit 24138494
Your Personal Tour Guide
Ask me questions while you tour the home.