243 Holbrook Rd Quincy, MA 02171
West Quincy NeighborhoodEstimated Value: $661,000 - $719,000
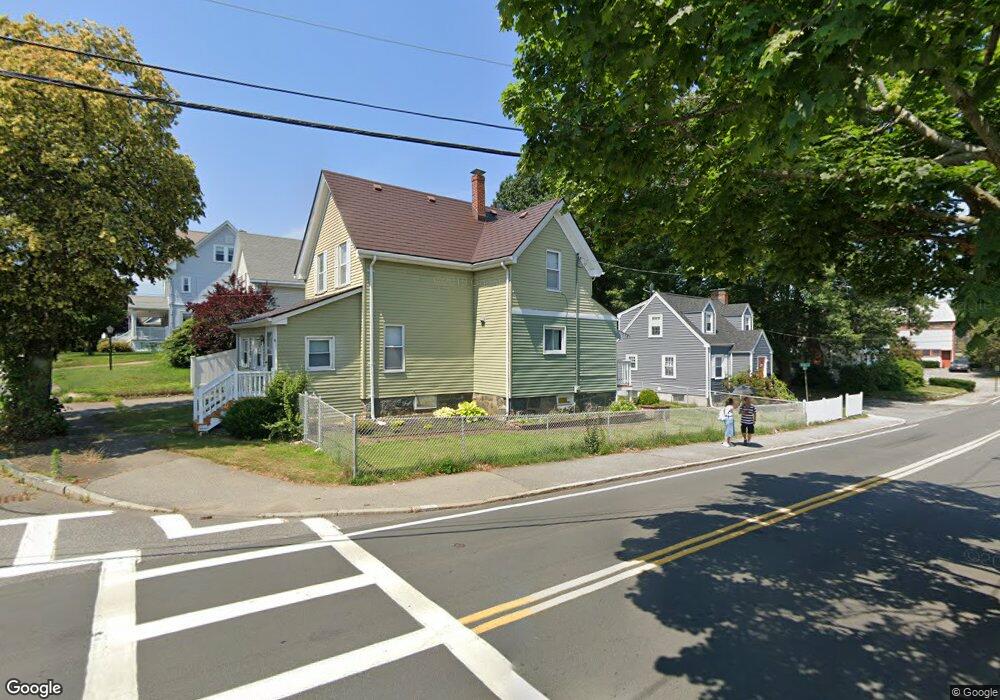
About This Home
This home is located at 243 Holbrook Rd, Quincy, MA 02171 and is currently estimated at $693,319, approximately $582 per square foot. 243 Holbrook Rd is a home located in Norfolk County with nearby schools including Montclair Elementary School, Atlantic Middle School, and North Quincy High School.
Ownership History
We collect this data history from publicly available records. To have your information removed, we recommend requesting removal directly through your county’s website.
Purchase Details
Home Financials for this Owner
Home Financials are based on the most recent Mortgage that was taken out on this home.Home Values in the Area
Average Home Value in this Area
Purchase History
We collect this data history from publicly available records. To have your information removed, we recommend requesting removal directly through your county’s website.
| Date | Buyer | Sale Price | Title Company |
|---|---|---|---|
| $318,000 | -- | ||
| $318,000 | -- |
Mortgage History
We collect this data history from publicly available records. To have your information removed, we recommend requesting removal directly through your county’s website.
| Date | Status | Borrower | Loan Amount |
|---|---|---|---|
| Open | $354,400 | ||
| Closed | $354,400 |
Tax History
We collect this data history from publicly available records. To have your information removed, we recommend requesting removal directly through your county’s website.
| Year | Tax Paid | Tax Assessment Tax Assessment Total Assessment is a certain percentage of the fair market value that is determined by local assessors to be the total taxable value of land and additions on the property. | Land | Improvement |
|---|---|---|---|---|
| 2025 | $6,808 | $590,500 | $324,200 | $266,300 |
| 2024 | $6,523 | $578,800 | $324,200 | $254,600 |
| 2023 | $6,119 | $549,800 | $308,800 | $241,000 |
| 2022 | $6,062 | $506,000 | $268,500 | $237,500 |
| 2021 | $5,655 | $465,800 | $255,700 | $210,100 |
| 2020 | $5,587 | $449,500 | $255,700 | $193,800 |
| 2019 | $5,389 | $429,400 | $239,000 | $190,400 |
| 2018 | $5,243 | $393,000 | $221,300 | $171,700 |
| 2017 | $5,108 | $360,500 | $210,800 | $149,700 |
| 2016 | $4,634 | $322,700 | $183,300 | $139,400 |
| 2015 | $4,292 | $294,000 | $166,600 | $127,400 |
| 2014 | $4,087 | $275,000 | $158,700 | $116,300 |
Map
- 89 Ardell St
- 60 Montclair Ave
- 28 Sagamore Ave
- 15 Becket St
- 60 Harriet Ave
- 115 W Squantum St Unit 203
- 30 Elmwood Park
- 45 Holbrook Rd
- 186 Granite Ave
- 135 Safford St
- 17 Holmes St Unit PH
- 19 Holmes St Unit 1
- 169 Pine St
- 16 W Squantum St
- 73 Washington St
- 17 Duggan Ln
- 267-269 Farrington St
- 85 Myrtle St Unit 106
- 13 Ash St
- 33 Bishop Rd Unit 33
- 288 W Squantum St
- 284 W Squantum St
- 282 W Squantum St
- 12 Harvard St Unit 2
- 14 Harvard St
- 14 Harvard St Unit 2
- 10 Harvard St
- 10 Harvard St Unit 1
- 278 W Squantum St
- 225 Holbrook Rd
- 231 Holbrook Rd
- 300 W Squantum St
- 300 W Squantum St Unit 2
- 300 W Squantum St Unit 1
- 221 Holbrook Rd
- 78 Sealund Rd
- 276 W Squantum St
- 239 Holbrook Rd
- 235 Holbrook Rd
- 293 W Squantum St
Ask me questions while you tour the home.