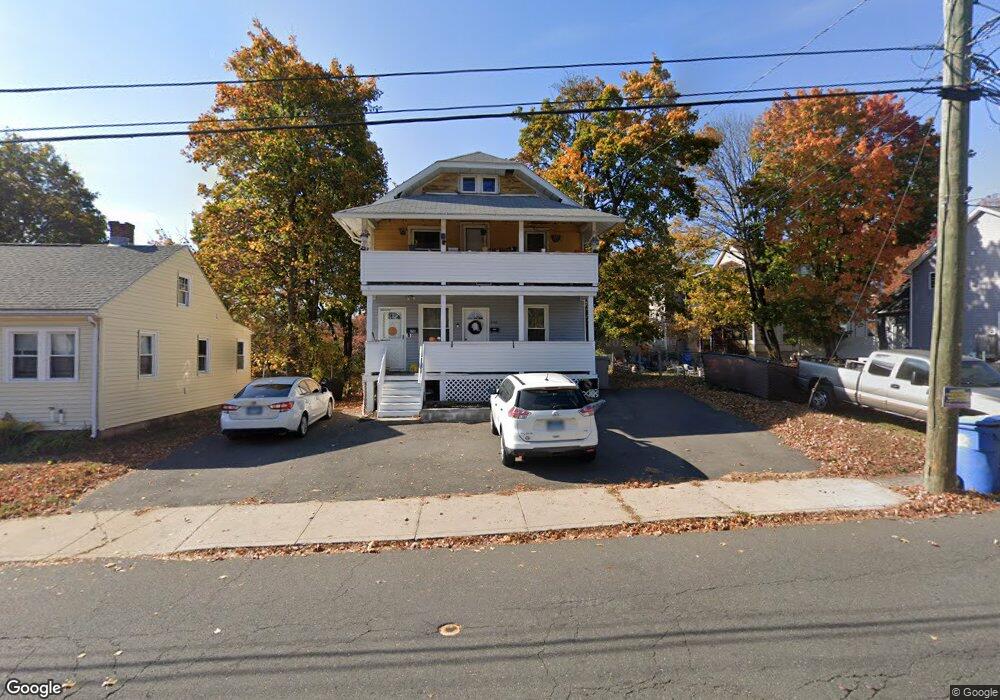
248 Queen St Bristol, CT 06010
Federal Hill NeighborhoodEstimated Value: $285,000 - $374,000
6
Beds
2
Baths
1,920
Sq Ft
$172/Sq Ft
Est. Value
About This Home
This home is located at 248 Queen St, Bristol, CT 06010 and is currently estimated at $330,284, approximately $172 per square foot. 248 Queen St is a home located in Hartford County with nearby schools including Ellen P. Hubbell School, Chippens Hill Middle School, and Bristol Eastern High School.
Ownership History
Date
Name
Owned For
Owner Type
Purchase Details
Closed on
Jan 9, 2012
Sold by
Morin Brian D
Bought by
Morin Brian D
Current Estimated Value
Home Financials for this Owner
Home Financials are based on the most recent Mortgage that was taken out on this home.
Original Mortgage
$108,700
Outstanding Balance
$12,492
Interest Rate
3.98%
Estimated Equity
$317,792
Purchase Details
Closed on
Jun 30, 2003
Sold by
Wells Brian R
Bought by
Morin Brian
Home Financials for this Owner
Home Financials are based on the most recent Mortgage that was taken out on this home.
Original Mortgage
$91,200
Interest Rate
5.53%
Purchase Details
Closed on
Dec 4, 2001
Sold by
Est Ingham Iii William and Ingham William H
Bought by
Wells Brian R
Home Financials for this Owner
Home Financials are based on the most recent Mortgage that was taken out on this home.
Original Mortgage
$36,000
Interest Rate
6.66%
Create a Home Valuation Report for This Property
The Home Valuation Report is an in-depth analysis detailing your home's value as well as a comparison with similar homes in the area
Home Values in the Area
Average Home Value in this Area
Purchase History
We collect this data history from publicly available records. To have your information removed, we recommend requesting removal directly through your county’s website.
| Date | Buyer | Sale Price | Title Company |
|---|---|---|---|
| Morin Brian D | -- | -- | |
| Morin Brian | $96,000 | -- | |
| Wells Brian R | $40,000 | -- |
Source: Public Records
Mortgage History
We collect this data history from publicly available records. To have your information removed, we recommend requesting removal directly through your county’s website.
| Date | Status | Borrower | Loan Amount |
|---|---|---|---|
| Open | Wells Brian R | $108,700 | |
| Previous Owner | Wells Brian R | $91,200 | |
| Previous Owner | Wells Brian R | $36,000 |
Source: Public Records
Tax History
| Year | Tax Paid | Tax Assessment Tax Assessment Total Assessment is a certain percentage of the fair market value that is determined by local assessors to be the total taxable value of land and additions on the property. | Land | Improvement |
|---|---|---|---|---|
| 2025 | $5,016 | $148,610 | $31,290 | $117,320 |
| 2024 | $4,733 | $148,610 | $31,290 | $117,320 |
| 2023 | $4,510 | $148,610 | $31,290 | $117,320 |
| 2022 | $3,718 | $96,950 | $23,660 | $73,290 |
| 2021 | $3,718 | $96,950 | $23,660 | $73,290 |
| 2020 | $3,718 | $96,950 | $23,660 | $73,290 |
| 2019 | $3,689 | $96,950 | $23,660 | $73,290 |
| 2018 | $3,576 | $96,950 | $23,660 | $73,290 |
| 2017 | $3,465 | $96,180 | $33,810 | $62,370 |
| 2016 | $3,465 | $96,180 | $33,810 | $62,370 |
| 2015 | $3,329 | $96,180 | $33,810 | $62,370 |
| 2014 | $3,329 | $96,180 | $33,810 | $62,370 |
Source: Public Records
Map
Nearby Homes
Your Personal Tour Guide
Ask me questions while you tour the home.