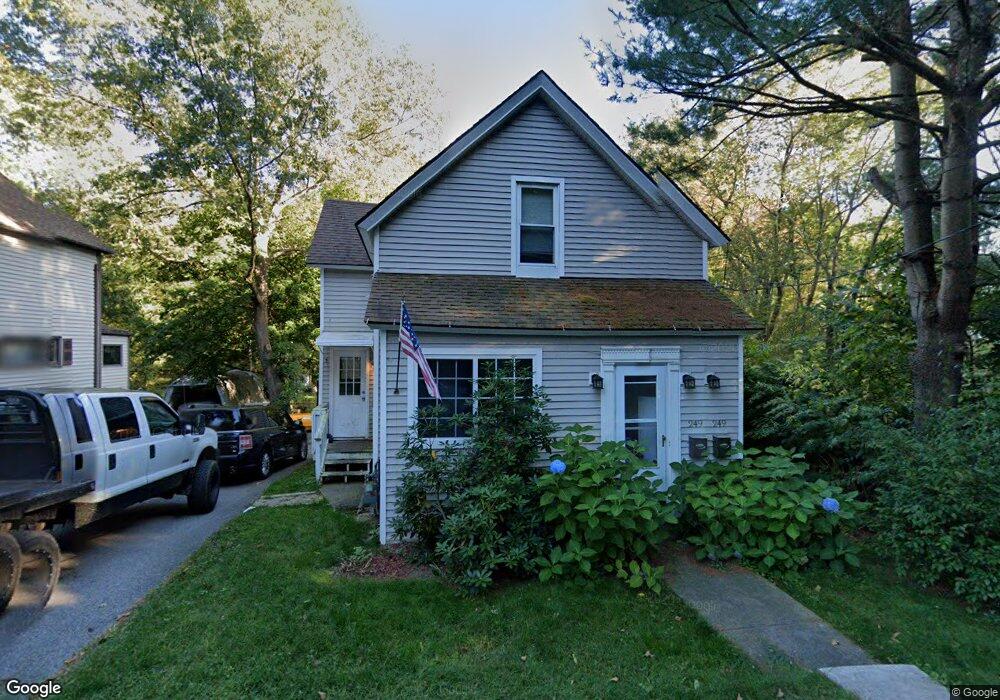
249 James St Worcester, MA 01603
Hadwen Park NeighborhoodEstimated Value: $311,232 - $404,000
4
Beds
1
Bath
1,400
Sq Ft
$243/Sq Ft
Est. Value
About This Home
This home is located at 249 James St, Worcester, MA 01603 and is currently estimated at $340,308, approximately $243 per square foot. 249 James St is a home located in Worcester County with nearby schools including Jacob Hiatt Magnet School, Chandler Magnet, and Heard Street Discovery Academy.
Ownership History
Date
Name
Owned For
Owner Type
Purchase Details
Closed on
May 18, 2007
Sold by
249 Jenkins T and Kunst K
Bought by
Mccormick Thomas J
Current Estimated Value
Home Financials for this Owner
Home Financials are based on the most recent Mortgage that was taken out on this home.
Original Mortgage
$195,000
Outstanding Balance
$118,097
Interest Rate
6.18%
Mortgage Type
Purchase Money Mortgage
Estimated Equity
$222,211
Purchase Details
Closed on
Nov 22, 2004
Sold by
Jenkins James B
Bought by
249 Jenkins T and Kunst K
Create a Home Valuation Report for This Property
The Home Valuation Report is an in-depth analysis detailing your home's value as well as a comparison with similar homes in the area
Home Values in the Area
Average Home Value in this Area
Purchase History
We collect this data history from publicly available records. To have your information removed, we recommend requesting removal directly through your county’s website.
| Date | Buyer | Sale Price | Title Company |
|---|---|---|---|
| Mccormick Thomas J | $195,000 | -- | |
| 249 Jenkins T | -- | -- |
Source: Public Records
Mortgage History
We collect this data history from publicly available records. To have your information removed, we recommend requesting removal directly through your county’s website.
| Date | Status | Borrower | Loan Amount |
|---|---|---|---|
| Open | Mccormick Thomas J | $195,000 |
Source: Public Records
Tax History
| Year | Tax Paid | Tax Assessment Tax Assessment Total Assessment is a certain percentage of the fair market value that is determined by local assessors to be the total taxable value of land and additions on the property. | Land | Improvement |
|---|---|---|---|---|
| 2025 | $2,885 | $218,700 | $97,900 | $120,800 |
| 2024 | $2,813 | $204,600 | $97,900 | $106,700 |
| 2023 | $2,667 | $186,000 | $85,100 | $100,900 |
| 2022 | $2,415 | $158,800 | $68,100 | $90,700 |
| 2021 | $2,392 | $146,900 | $54,500 | $92,400 |
| 2020 | $2,304 | $135,500 | $54,100 | $81,400 |
| 2019 | $2,268 | $126,000 | $47,200 | $78,800 |
| 2018 | $2,277 | $120,400 | $47,200 | $73,200 |
| 2017 | $2,162 | $112,500 | $47,200 | $65,300 |
| 2016 | $2,094 | $101,600 | $33,500 | $68,100 |
| 2015 | $2,039 | $101,600 | $33,500 | $68,100 |
| 2014 | $1,985 | $101,600 | $33,500 | $68,100 |
Source: Public Records
Map
Nearby Homes
Your Personal Tour Guide
Ask me questions while you tour the home.