
Seller's Agent in 2018
David Trottier
Realty Sales Inc
(207) 229-0559
9 in this area
132 Total Sales


Estimated Value: $400,000 - $473,000
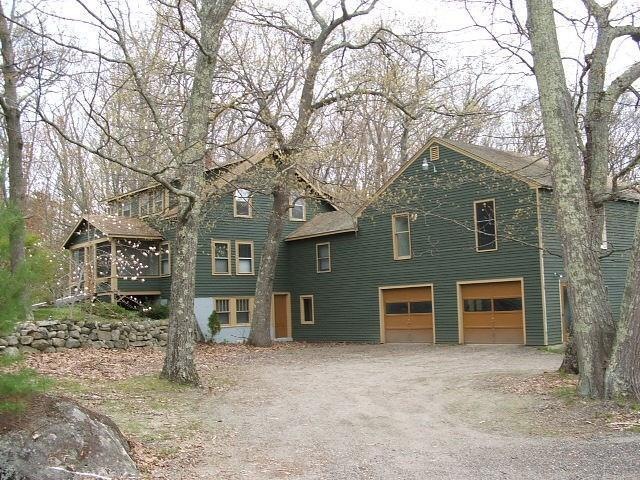
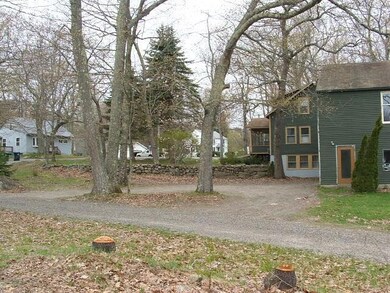
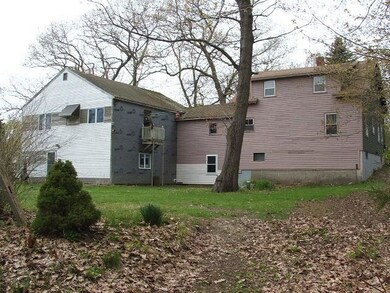
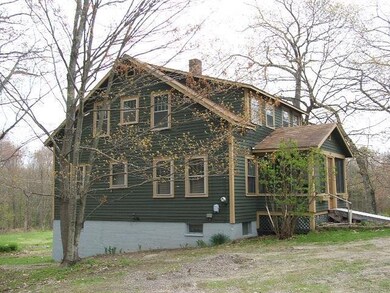
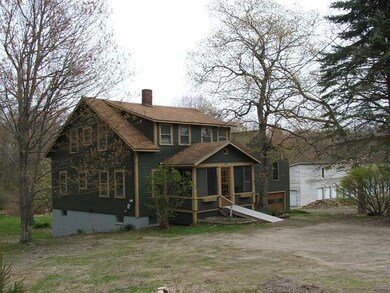
ADDITIONAL HOUSE LOTS! Cape Cod home with acreage for additional 2+ building lots. Home also offers 980 sq ft of expandable living space over the garage (family room or apartment. Zone allows). Back of house needs to be painted. 2nd floor bedrooms offer hardwood flooring, but need some cosmetic wall & ceiling finishes, and heat source. 1st floor is in good condition.Property does need some repairs, but is priced accordingly to it's existing condition, along with the two house lots in mind. PLEASE READ THE PROPERTY DISCLOSURES PRIOR TO SCHEDULING A SHOWING. SHOWING TIMES ARE ON MONDAY,WEDNESDAY & SATURDAY FROM 10:00-3:00.
We collect this data history from publicly available records. To have your information removed, we recommend requesting removal directly through your county’s website.
We collect this data history from publicly available records. To have your information removed, we recommend requesting removal directly through your county’s website.
| Date | Buyer | Sale Price | Title Company |
|---|---|---|---|
| -- | None Available | ||
| -- | None Available | ||
| -- | None Available | ||
| -- | -- | ||
| -- | -- | ||
| -- | -- | ||
| -- | -- | ||
| -- | -- | ||
| -- | -- | ||
| -- | -- | ||
| -- | -- | ||
| -- | -- |
We collect this data history from publicly available records. To have your information removed, we recommend requesting removal directly through your county’s website.
| Date | Status | Borrower | Loan Amount |
|---|---|---|---|
| Open | $245,471 | ||
| Closed | $245,471 | ||
| Previous Owner | $150,000 | ||
| Previous Owner | $170,000 |
We collect this data history from publicly available records. To have your information removed, we recommend requesting removal directly through your county’s website.
| Date | Event | Price | List to Sale | Price per Sq Ft |
|---|---|---|---|---|
| 06/13/2018 06/13/18 | Sold | $170,000 | -24.8% | $100 / Sq Ft |
| 05/31/2018 05/31/18 | Pending | -- | -- | -- |
| 01/22/2018 01/22/18 | For Sale | $226,000 | -- | $133 / Sq Ft |
We collect this data history from publicly available records. To have your information removed, we recommend requesting removal directly through your county’s website.
| Year | Tax Paid | Tax Assessment Tax Assessment Total Assessment is a certain percentage of the fair market value that is determined by local assessors to be the total taxable value of land and additions on the property. | Land | Improvement |
|---|---|---|---|---|
| 2025 | $4,306 | $288,200 | $166,600 | $121,600 |
| 2024 | $4,065 | $285,900 | $166,600 | $119,300 |
| 2023 | $3,712 | $282,900 | $163,600 | $119,300 |
| 2022 | $3,853 | $234,800 | $92,300 | $142,500 |
| 2021 | $3,588 | $196,800 | $78,000 | $118,800 |
| 2020 | $3,593 | $179,200 | $70,900 | $108,300 |
| 2019 | $3,610 | $180,700 | $72,400 | $108,300 |
| 2018 | $3,560 | $180,700 | $72,400 | $108,300 |
| 2017 | $2,439 | $176,800 | $72,400 | $104,400 |
| 2016 | $3,517 | $177,100 | $72,700 | $104,400 |
| 2015 | $3,253 | $177,100 | $72,700 | $104,400 |
| 2014 | $3,173 | $177,100 | $72,700 | $104,400 |
| 2013 | -- | $197,700 | $64,200 | $133,500 |
Seller's Agent in 2018
David Trottier
Realty Sales Inc
(207) 229-0559
9 in this area
132 Total Sales
Buyer's Agent in 2018
Matthew Chamberlain
Regency Realty Group
(207) 450-7653
62 Total Sales
Source: Maine Listings
MLS Number: 1336729
APN: BIDD-000026-000000-000008
Disclaimer: Certain information contained herein is derived from information provided by parties other than Homes.com. All information provided is deemed reliable, but is not guaranteed to be accurate and should be independently verified.
![]() Listing data is derived in whole or in part from Maine Real Estate Information System, Inc. (d/b/a Maine Listings) and is for consumers' personal, noncommercial use only. Dimensions are approximate and not guaranteed. All data should be independently verified.
Listing data is derived in whole or in part from Maine Real Estate Information System, Inc. (d/b/a Maine Listings) and is for consumers' personal, noncommercial use only. Dimensions are approximate and not guaranteed. All data should be independently verified.
© 2026 Maine Real Estate Information System, Inc. All Rights Reserved. Equal Housing Opportunity.
Homes.com, LLC, 17600 Laguna Canyon Rd Irvine, CA 92618 (888)-952-6393
![]()
Ask me questions while you tour the home.