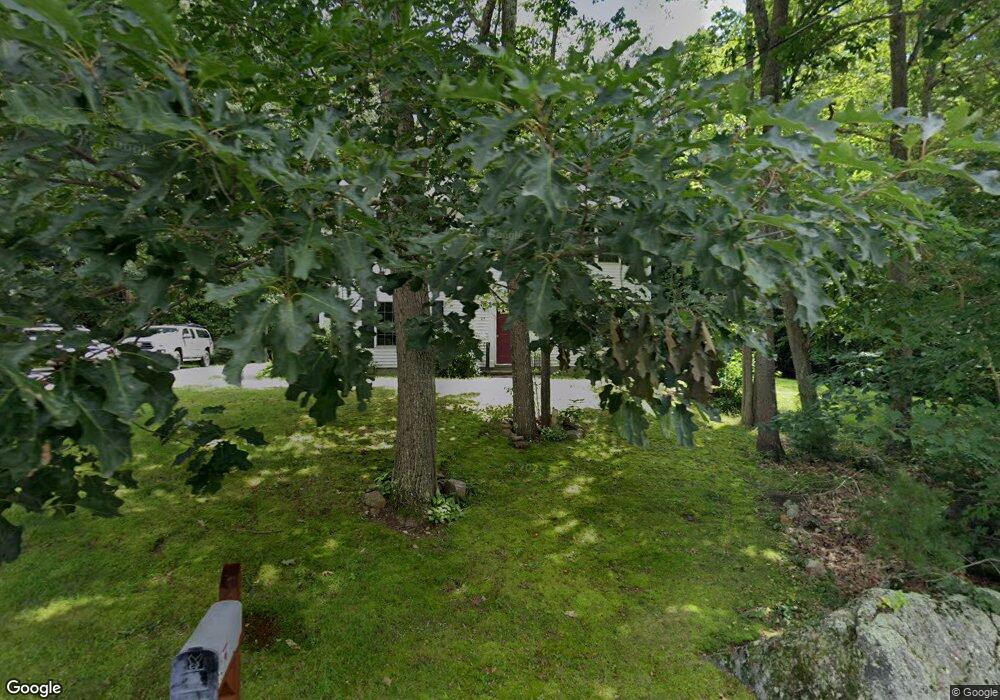
25 Allen St Springvale, ME 04083
Estimated Value: $358,000 - $407,000
3
Beds
2
Baths
1,512
Sq Ft
$249/Sq Ft
Est. Value
About This Home
This home is located at 25 Allen St, Springvale, ME 04083 and is currently estimated at $376,400, approximately $248 per square foot. 25 Allen St is a home located in York County with nearby schools including St Thomas Consolidated School and Sanford Christian Academy.
Ownership History
Date
Name
Owned For
Owner Type
Purchase Details
Closed on
Apr 21, 2010
Sold by
Bergeron Richard J
Bought by
Mcnally James B
Current Estimated Value
Home Financials for this Owner
Home Financials are based on the most recent Mortgage that was taken out on this home.
Original Mortgage
$145,600
Outstanding Balance
$96,218
Interest Rate
5%
Mortgage Type
Unknown
Estimated Equity
$280,182
Create a Home Valuation Report for This Property
The Home Valuation Report is an in-depth analysis detailing your home's value as well as a comparison with similar homes in the area
Home Values in the Area
Average Home Value in this Area
Purchase History
| Date | Buyer | Sale Price | Title Company |
|---|---|---|---|
| Mcnally James B | -- | -- |
Source: Public Records
Mortgage History
| Date | Status | Borrower | Loan Amount |
|---|---|---|---|
| Open | Mcnally James B | $145,600 |
Source: Public Records
Tax History
| Year | Tax Paid | Tax Assessment Tax Assessment Total Assessment is a certain percentage of the fair market value that is determined by local assessors to be the total taxable value of land and additions on the property. | Land | Improvement |
|---|---|---|---|---|
| 2025 | $5,221 | $305,300 | $43,400 | $261,900 |
| 2024 | $4,928 | $305,300 | $43,400 | $261,900 |
| 2023 | $4,584 | $302,800 | $43,400 | $259,400 |
| 2022 | $4,481 | $302,800 | $43,400 | $259,400 |
| 2021 | $4,410 | $242,600 | $43,400 | $199,200 |
| 2020 | $4,193 | $208,000 | $43,400 | $164,600 |
| 2019 | $4,101 | $198,100 | $43,400 | $154,700 |
| 2018 | $3,891 | $189,800 | $43,400 | $146,400 |
| 2017 | $3,731 | $179,900 | $43,400 | $136,500 |
| 2016 | $3,861 | $169,800 | $43,400 | $126,400 |
| 2015 | $3,498 | $168,700 | $45,600 | $123,100 |
| 2014 | $3,457 | $168,700 | $45,600 | $123,100 |
| 2013 | -- | $169,900 | $45,600 | $124,300 |
Source: Public Records
Map
Nearby Homes
Your Personal Tour Guide
Ask me questions while you tour the home.