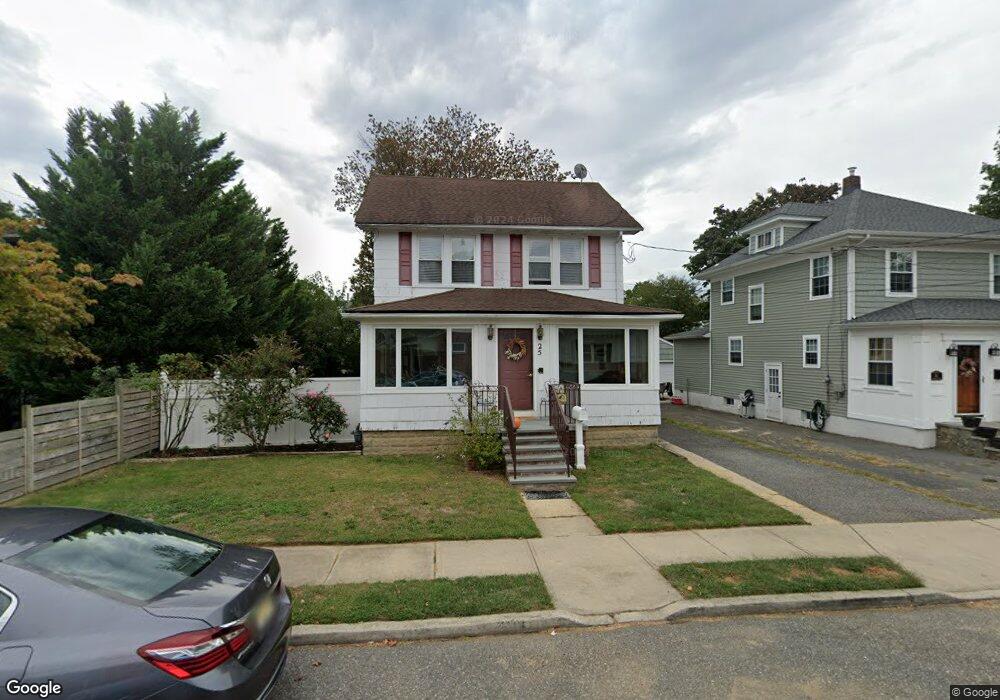
25 Applegate St Red Bank, NJ 07701
New Monmouth NeighborhoodEstimated Value: $682,000 - $766,000
3
Beds
2
Baths
1,510
Sq Ft
$473/Sq Ft
Est. Value
About This Home
This home is located at 25 Applegate St, Red Bank, NJ 07701 and is currently estimated at $714,616, approximately $473 per square foot. 25 Applegate St is a home located in Monmouth County with nearby schools including River Plaza Elementary School, Thompson Middle School, and Middletown - South High School.
Ownership History
Date
Name
Owned For
Owner Type
Purchase Details
Closed on
May 19, 1995
Sold by
Dubrowsky Geoffrey
Bought by
Guzman Cesareo and Koelbl Patricial
Current Estimated Value
Home Financials for this Owner
Home Financials are based on the most recent Mortgage that was taken out on this home.
Original Mortgage
$119,000
Interest Rate
8.33%
Mortgage Type
FHA
Create a Home Valuation Report for This Property
The Home Valuation Report is an in-depth analysis detailing your home's value as well as a comparison with similar homes in the area
Home Values in the Area
Average Home Value in this Area
Purchase History
| Date | Buyer | Sale Price | Title Company |
|---|---|---|---|
| Guzman Cesareo | $120,000 | -- |
Source: Public Records
Mortgage History
| Date | Status | Borrower | Loan Amount |
|---|---|---|---|
| Closed | Guzman Cesareo | $119,000 |
Source: Public Records
Tax History
| Year | Tax Paid | Tax Assessment Tax Assessment Total Assessment is a certain percentage of the fair market value that is determined by local assessors to be the total taxable value of land and additions on the property. | Land | Improvement |
|---|---|---|---|---|
| 2025 | $9,421 | $625,900 | $455,000 | $170,900 |
| 2024 | $8,308 | $572,700 | $405,000 | $167,700 |
| 2023 | $8,308 | $478,000 | $359,200 | $118,800 |
| 2022 | $6,928 | $380,700 | $267,500 | $113,200 |
| 2021 | $6,928 | $333,100 | $232,500 | $100,600 |
| 2020 | $6,380 | $298,400 | $200,000 | $98,400 |
| 2019 | $6,290 | $297,800 | $200,000 | $97,800 |
| 2018 | $6,356 | $293,300 | $200,000 | $93,300 |
| 2017 | $6,168 | $290,400 | $200,000 | $90,400 |
| 2016 | $6,063 | $284,500 | $185,000 | $99,500 |
| 2015 | $6,056 | $283,500 | $185,000 | $98,500 |
| 2014 | $5,473 | $250,000 | $160,000 | $90,000 |
Source: Public Records
Map
Nearby Homes
- 75 Carpenter St
- 13 Applegate St
- 40 Foster St
- 928 Park Place
- 921 Park Place
- 37 Hubbard Ave
- 73 Hubbard Ave
- 47 Mclean St
- 7 Buchhop Ln
- 5 Buchhop Ln
- 6 Buchhop Ln
- 24 Leighton Ave
- 8 Todd Dr
- 3 Auburn Ct
- 98C Berkshire Ct
- 9 Locust Ave
- 194 River St
- 80 Manchester Ct
- 94 Manchester Ct Unit 94B
- 22 Claremont Ct Unit 33E
Your Personal Tour Guide
Ask me questions while you tour the home.