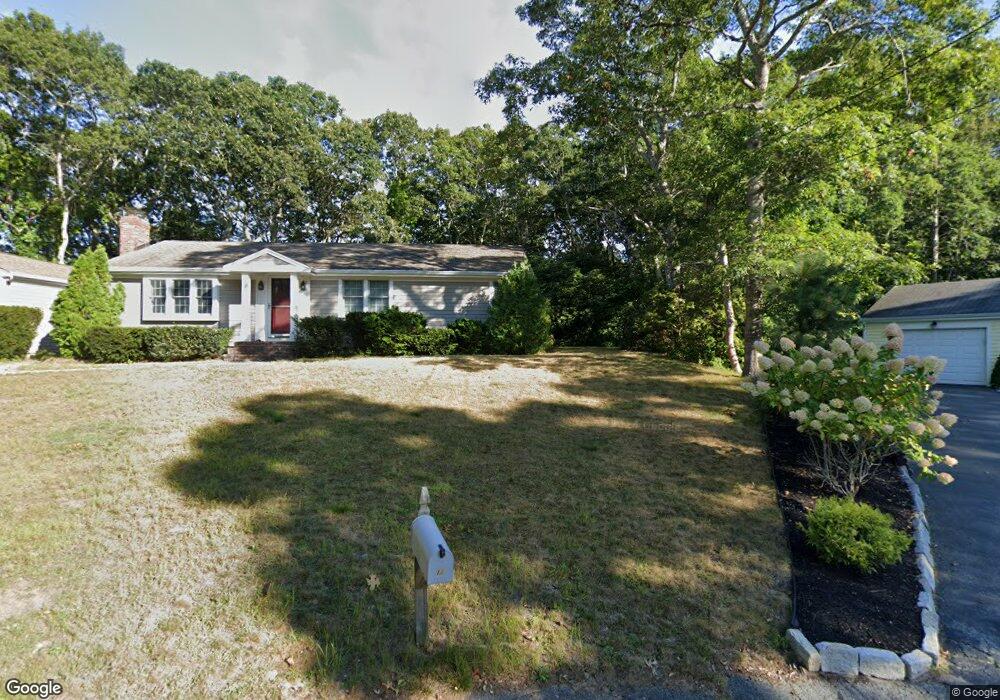
25 Carver Rd Dennis, MA 02638
Dennis Port NeighborhoodEstimated Value: $567,000 - $676,000
3
Beds
1
Bath
1,024
Sq Ft
$605/Sq Ft
Est. Value
About This Home
This home is located at 25 Carver Rd, Dennis, MA 02638 and is currently estimated at $619,960, approximately $605 per square foot. 25 Carver Rd is a home located in Barnstable County with nearby schools including Dennis-Yarmouth Regional High School and St. Pius X. School.
Ownership History
Date
Name
Owned For
Owner Type
Purchase Details
Closed on
Jan 27, 2025
Sold by
Feeney John P and Feeney Teresa L
Bought by
Feeney Irt and Poles
Current Estimated Value
Purchase Details
Closed on
Feb 3, 2020
Sold by
Miceli Salvatore J and Miceli Rita L
Bought by
Feeney John P and Feeney Teresa L
Purchase Details
Closed on
Nov 19, 2004
Sold by
Miceli Ft and Sullivan
Bought by
Sullivan Anna V and Miceli Rita L
Create a Home Valuation Report for This Property
The Home Valuation Report is an in-depth analysis detailing your home's value as well as a comparison with similar homes in the area
Home Values in the Area
Average Home Value in this Area
Purchase History
| Date | Buyer | Sale Price | Title Company |
|---|---|---|---|
| Feeney Irt | -- | None Available | |
| Feeney Irt | -- | None Available | |
| Feeney John P | $370,000 | None Available | |
| Feeney John P | $370,000 | None Available | |
| Sullivan Anna V | -- | -- | |
| Sullivan Anna V | -- | -- |
Source: Public Records
Tax History
| Year | Tax Paid | Tax Assessment Tax Assessment Total Assessment is a certain percentage of the fair market value that is determined by local assessors to be the total taxable value of land and additions on the property. | Land | Improvement |
|---|---|---|---|---|
| 2025 | $2,576 | $595,000 | $281,400 | $313,600 |
| 2024 | $2,440 | $555,700 | $270,700 | $285,000 |
| 2023 | $2,359 | $505,100 | $246,000 | $259,100 |
| 2022 | $2,154 | $384,600 | $193,900 | $190,700 |
| 2021 | $2,043 | $338,800 | $190,100 | $148,700 |
| 2020 | $2,015 | $330,300 | $190,100 | $140,200 |
| 2019 | $2,059 | $333,700 | $202,400 | $131,300 |
| 2018 | $2,007 | $316,500 | $192,700 | $123,800 |
| 2017 | $1,853 | $301,300 | $177,500 | $123,800 |
| 2016 | $1,775 | $271,800 | $167,300 | $104,500 |
| 2015 | $1,740 | $271,800 | $167,300 | $104,500 |
| 2014 | $1,752 | $275,900 | $157,200 | $118,700 |
Source: Public Records
Map
Nearby Homes
- 9 Chase Ave Unit 6
- 433 Lower County Rd Unit 19
- 65 Inman Rd Unit A
- 67 Inman Rd Unit E
- 97 Depot St
- 253 Shad Hole Rd Unit 3A
- 6 Oak St
- 291 Old Wharf Rd Unit 14
- 6 Manning Rd
- 37A Beach Hills Rd
- 18 Manning Rd
- 117 Depot St
- 34 Pleasant St Unit 3
- 262 Old Wharf Rd Unit 5
- 262 Old Wharf Rd Unit 5
- 262 Old Wharf Rd Unit 87
- 1 E Belmont Unit 513
- 1 E Belmont Unit 425
- 1 E Belmont Unit TH18
- 1 E Belmont Unit 541
Your Personal Tour Guide
Ask me questions while you tour the home.