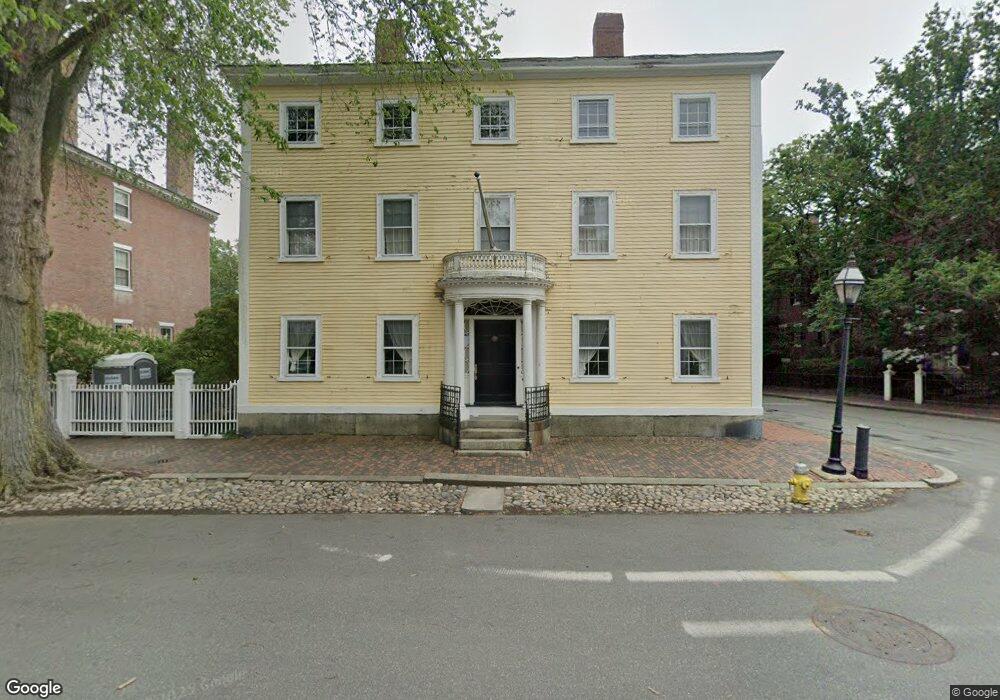
25 Chestnut St Salem, MA 01970
Downtown Salem NeighborhoodEstimated Value: $1,922,198 - $2,274,000
About This Home
This home is located at 25 Chestnut St, Salem, MA 01970 and is currently estimated at $2,061,050, approximately $408 per square foot. 25 Chestnut St is a home located in Essex County with nearby schools including Saltonstall School, Horace Mann Laboratory, and Carlton Elementary School.
Ownership History
We collect this data history from publicly available records. To have your information removed, we recommend requesting removal directly through your county’s website.
Purchase Details
Purchase Details
Purchase Details
Purchase Details
Home Values in the Area
Average Home Value in this Area
Purchase History
We collect this data history from publicly available records. To have your information removed, we recommend requesting removal directly through your county’s website.
| Date | Buyer | Sale Price | Title Company |
|---|---|---|---|
| -- | None Available | ||
| $836,500 | -- | ||
| -- | -- | ||
| $430,000 | -- |
Mortgage History
We collect this data history from publicly available records. To have your information removed, we recommend requesting removal directly through your county’s website.
| Date | Status | Borrower | Loan Amount |
|---|---|---|---|
| Previous Owner | $270,900 | ||
| Previous Owner | $539,000 | ||
| Previous Owner | $50,000 |
Tax History
We collect this data history from publicly available records. To have your information removed, we recommend requesting removal directly through your county’s website.
| Year | Tax Paid | Tax Assessment Tax Assessment Total Assessment is a certain percentage of the fair market value that is determined by local assessors to be the total taxable value of land and additions on the property. | Land | Improvement |
|---|---|---|---|---|
| 2025 | $19,482 | $1,718,000 | $271,400 | $1,446,600 |
| 2024 | $18,908 | $1,627,200 | $259,000 | $1,368,200 |
| 2023 | $18,615 | $1,488,000 | $234,400 | $1,253,600 |
| 2022 | $14,673 | $1,107,400 | $222,000 | $885,400 |
| 2021 | $15,017 | $1,088,200 | $222,000 | $866,200 |
| 2020 | $15,421 | $1,067,200 | $215,900 | $851,300 |
| 2019 | $14,893 | $986,300 | $207,200 | $779,100 |
| 2018 | $13,391 | $870,700 | $197,400 | $673,300 |
| 2017 | $13,002 | $819,800 | $185,000 | $634,800 |
| 2016 | $12,702 | $810,600 | $175,800 | $634,800 |
| 2015 | $13,599 | $828,700 | $175,800 | $652,900 |
Map
- 33 Chestnut St
- 7 Hamilton St Unit 3
- 395 Essex St
- 394 Essex St Unit 3
- 18 Summer St
- 401 Essex St
- 9 Phelps St
- 59 Summer St
- 23 Summer St Unit 3
- 23 Summer St Unit 9
- 23 Summer St Unit 2
- 23 Summer St Unit 10
- 23 Summer St Unit 8
- 314 Essex St
- 18 Phelps St Unit 1
- 2 Andover St Unit B
- 15 River St
- 289 Essex St Unit 308
- 75 Summer St Unit 5
- 7 Crombie St Unit 4
- 7 Pickering St
- 7 Pickering St
- 7 Pickering St Unit 1
- 65 Pickering St Unit 65B
- 27 Chestnut St
- 84 Pickering St Unit 56
- 100 Pickering St Unit 100D
- 29 Chestnut St
- 4 Pickering St
- 28 Chestnut St
- 26 Chestnut St
- 24 Chestnut St Unit 2
- 24 Chestnut St Unit 1
- 21 Chestnut St
- 30 Chestnut St
- 31 Chestnut St
- 31 Chestnut St Unit Rear
- 33 Chestnut St Unit 2
- 19 Chestnut St
- 1 Pickering St
Ask me questions while you tour the home.