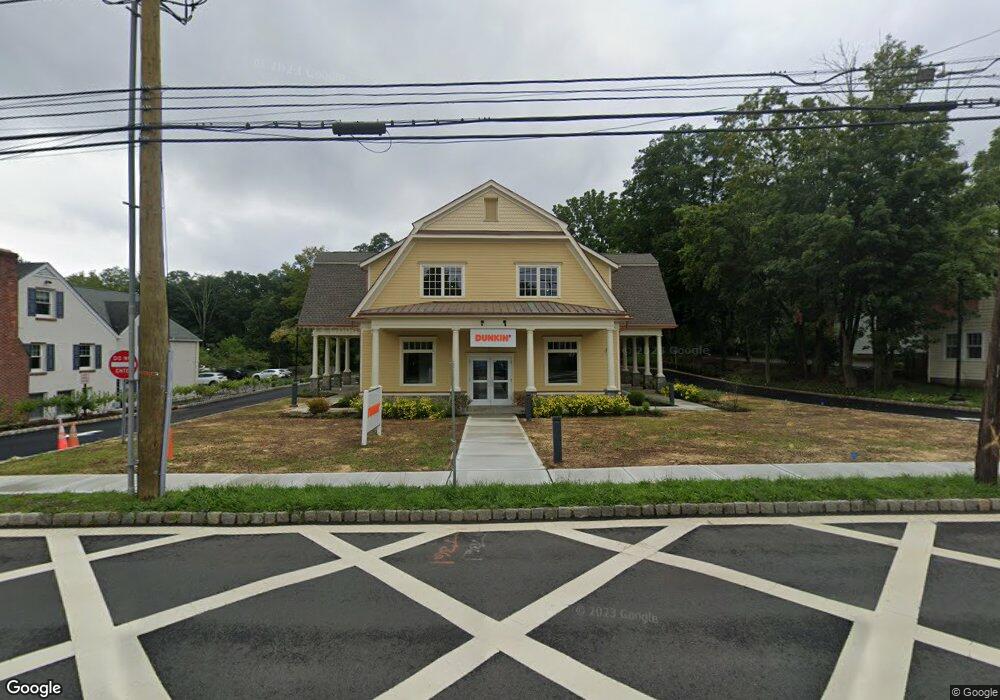
25 E Main St Unit 1 Mendham Borough, NJ 07945
Estimated Value: $775,000 - $931,000
2
Beds
1
Bath
1,819
Sq Ft
$471/Sq Ft
Est. Value
About This Home
This home is located at 25 E Main St Unit 1, Mendham Borough, NJ 07945 and is currently estimated at $856,838, approximately $471 per square foot. 25 E Main St Unit 1 is a home located in Morris County with nearby schools including Hilltop Elementary School, Mountain View Middle School, and West Morris Mendham High School.
Ownership History
Date
Name
Owned For
Owner Type
Purchase Details
Closed on
Jul 17, 2018
Sold by
Polcer John E and Polcer Carolyn
Bought by
Puckett Brittany
Current Estimated Value
Home Financials for this Owner
Home Financials are based on the most recent Mortgage that was taken out on this home.
Original Mortgage
$502,000
Outstanding Balance
$304,648
Interest Rate
4.6%
Mortgage Type
New Conventional
Estimated Equity
$552,190
Purchase Details
Closed on
Sep 9, 2014
Sold by
Smith Anne M and Estate Of Helen M Noble
Bought by
Polcer John and Polcer Carolyn
Create a Home Valuation Report for This Property
The Home Valuation Report is an in-depth analysis detailing your home's value as well as a comparison with similar homes in the area
Home Values in the Area
Average Home Value in this Area
Purchase History
| Date | Buyer | Sale Price | Title Company |
|---|---|---|---|
| Puckett Brittany | $542,000 | None Available | |
| Polcer John | $350,000 | Multiple |
Source: Public Records
Mortgage History
| Date | Status | Borrower | Loan Amount |
|---|---|---|---|
| Open | Puckett Brittany | $502,000 |
Source: Public Records
Tax History
| Year | Tax Paid | Tax Assessment Tax Assessment Total Assessment is a certain percentage of the fair market value that is determined by local assessors to be the total taxable value of land and additions on the property. | Land | Improvement |
|---|---|---|---|---|
| 2025 | $11,582 | $661,400 | $402,700 | $258,700 |
| 2024 | $11,423 | $596,400 | $351,000 | $245,400 |
Source: Public Records
Map
Nearby Homes
- 3 New St
- 4 Franklin Rd
- 40 Mountain Ave
- 7 Tempe Wick Rd
- 63 Mountain Ave
- 48 Maple Ave
- 41 Franklin Rd
- 32 Deerfield Rd
- 14 Pembroke Dr
- 67 Hampshire Dr
- 56 Mountainside Rd
- 6 Cromwell Ln
- 14 Cooper Rd
- 211 Mountainside Rd
- 10 Ironia Rd
- 301 Hilltop Rd
- 54 Wexford Dr
- 465 Cherry Ln
- 239B Mountainside Rd
- 290 Mountainside Rd
- 25 E Main St
- 27 E Main St
- 23 E Main St
- 23 E Main St
- 21 E Main St
- 21 E Main St Unit 21
- 20 E Main St
- 24 E Main St
- 22 E Main St
- 20 E Main St
- 16 E Main St
- 19 E Main St Unit C
- 19 E Main St
- 19 E Main St Unit 3 (C)
- 33 E Main St
- 15 E Main St Unit 3rd
- 15 E Main St Unit 1
- 15 E Main St
- 15 E Main St
- 30 E Main St
Your Personal Tour Guide
Ask me questions while you tour the home.