Estimated Value: $72,884
3
Beds
2
Baths
1,288
Sq Ft
$57/Sq Ft
Est. Value
About This Home
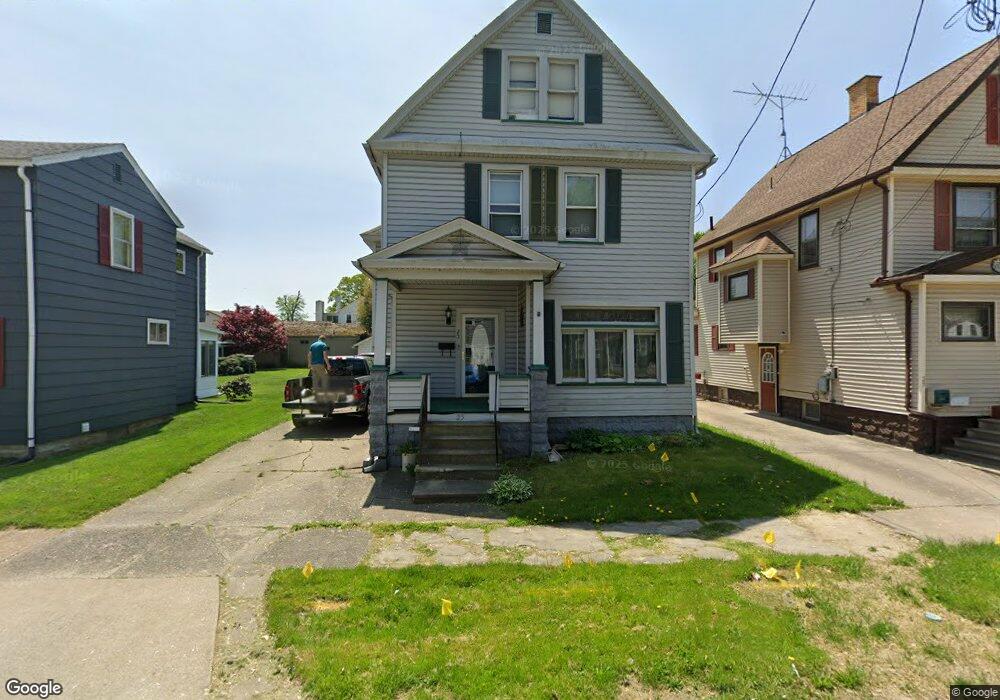
This home is located at 25 Maple St, Niles, OH 44446 and is currently estimated at $72,884, approximately $56 per square foot. 25 Maple St is a home located in Trumbull County with nearby schools including Niles Primary School, Niles Intermediate School, and Niles Middle School.
Ownership History
Date
Name
Owned For
Owner Type
Purchase Details
Closed on
Feb 28, 2021
Sold by
Wilke Frank R and Wilke Jessica L
Bought by
Wilke Allyson Marie and Wolf Jason Robert
Current Estimated Value
Home Financials for this Owner
Home Financials are based on the most recent Mortgage that was taken out on this home.
Original Mortgage
$49,500
Interest Rate
3.92%
Mortgage Type
New Conventional
Purchase Details
Closed on
Nov 6, 2012
Sold by
Hornsby Roger E and Hornsby Roberta K
Bought by
Wilke Frank R and Wilke Jessica L
Purchase Details
Closed on
Jan 1, 1990
Bought by
Roger Roger E and Roger S
Create a Home Valuation Report for This Property
The Home Valuation Report is an in-depth analysis detailing your home's value as well as a comparison with similar homes in the area
Home Values in the Area
Average Home Value in this Area
Purchase History
| Date | Buyer | Sale Price | Title Company |
|---|---|---|---|
| Wilke Allyson Marie | -- | None Listed On Document | |
| Wilke Frank R | $25,000 | None Available | |
| Roger Roger E | -- | -- |
Source: Public Records
Mortgage History
| Date | Status | Borrower | Loan Amount |
|---|---|---|---|
| Previous Owner | Wilke Allyson Marie | $49,500 |
Source: Public Records
Tax History
| Year | Tax Paid | Tax Assessment Tax Assessment Total Assessment is a certain percentage of the fair market value that is determined by local assessors to be the total taxable value of land and additions on the property. | Land | Improvement |
|---|---|---|---|---|
| 2024 | $888 | $20,520 | $1,720 | $18,800 |
| 2023 | $880 | $20,520 | $1,720 | $18,800 |
| 2022 | $660 | $13,520 | $1,720 | $11,800 |
| 2021 | $693 | $13,520 | $1,720 | $11,800 |
| 2020 | $700 | $13,520 | $1,720 | $11,800 |
| 2019 | $710 | $13,060 | $1,720 | $11,340 |
| 2018 | $708 | $13,060 | $1,720 | $11,340 |
| 2017 | $704 | $13,060 | $1,720 | $11,340 |
| 2016 | $757 | $13,900 | $1,720 | $12,180 |
| 2015 | $748 | $13,900 | $1,720 | $12,180 |
| 2014 | $751 | $13,900 | $1,720 | $12,180 |
| 2013 | $797 | $15,580 | $1,720 | $13,860 |
Source: Public Records
Map
Nearby Homes
Your Personal Tour Guide
Ask me questions while you tour the home.