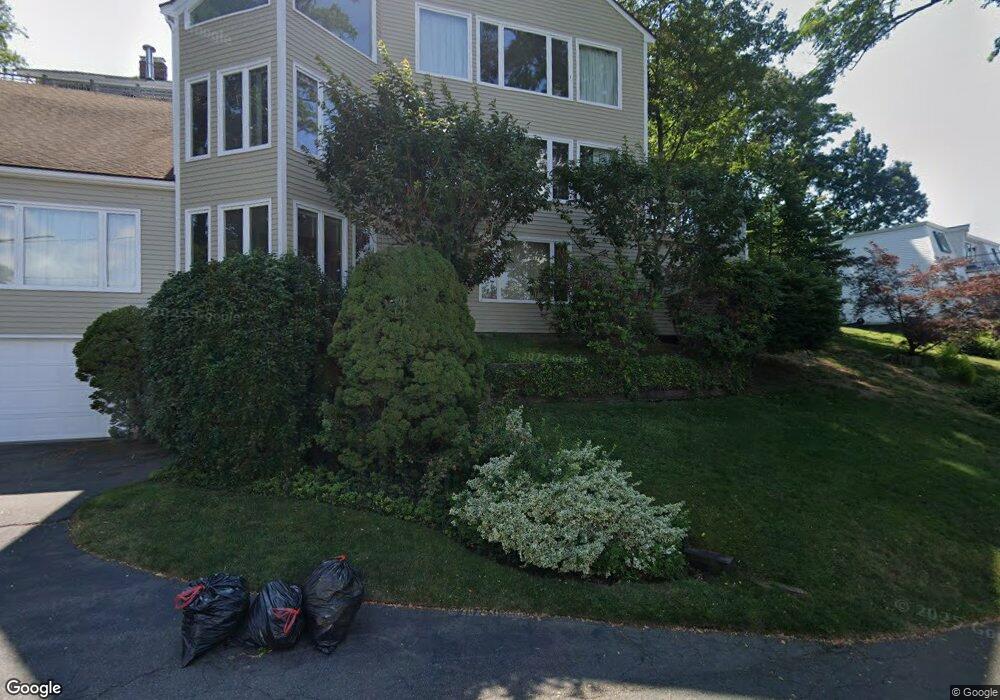
25 Sparhawk Terrace Marblehead, MA 01945
Estimated Value: $1,414,000 - $1,811,000
4
Beds
4
Baths
1,817
Sq Ft
$882/Sq Ft
Est. Value
About This Home
This home is located at 25 Sparhawk Terrace, Marblehead, MA 01945 and is currently estimated at $1,602,488, approximately $881 per square foot. 25 Sparhawk Terrace is a home located in Essex County with nearby schools including Marblehead High School, Marblehead Community Charter Public School, and Tower School.
Ownership History
Date
Name
Owned For
Owner Type
Purchase Details
Closed on
Sep 9, 2010
Sold by
Dibartolo Anthony F and Dibartolo Charcretia V
Bought by
Dibartolo Anthony F and Dibartolo Charcretia V
Current Estimated Value
Home Financials for this Owner
Home Financials are based on the most recent Mortgage that was taken out on this home.
Original Mortgage
$417,000
Interest Rate
4.55%
Mortgage Type
Purchase Money Mortgage
Purchase Details
Closed on
Feb 4, 2005
Sold by
Yetter Cathy M and Yetter Frank C
Bought by
Dibartolo Charcretia W and Dibartolo Anthony F
Purchase Details
Closed on
Sep 30, 1999
Sold by
Mazonson Paulm and Mazonson Kathleen Way
Bought by
Yetter Frank C and Yetter Cathy M
Purchase Details
Closed on
Sep 1, 1998
Sold by
Hearne Nancy M
Bought by
Hostrop Frederick W and Hostrop Arlene L
Create a Home Valuation Report for This Property
The Home Valuation Report is an in-depth analysis detailing your home's value as well as a comparison with similar homes in the area
Home Values in the Area
Average Home Value in this Area
Purchase History
We collect this data history from publicly available records. To have your information removed, we recommend requesting removal directly through your county’s website.
| Date | Buyer | Sale Price | Title Company |
|---|---|---|---|
| Dibartolo Anthony F | -- | -- | |
| Dibartolo Anthony F | -- | -- | |
| Dibartolo Charcretia W | $765,000 | -- | |
| Dibartolo Charcretia W | $765,000 | -- | |
| Yetter Frank C | $490,000 | -- | |
| Yetter Frank C | $490,000 | -- | |
| Hostrop Frederick W | $320,000 | -- | |
| Hostrop Frederick W | $320,000 | -- |
Source: Public Records
Mortgage History
We collect this data history from publicly available records. To have your information removed, we recommend requesting removal directly through your county’s website.
| Date | Status | Borrower | Loan Amount |
|---|---|---|---|
| Open | Hostrop Frederick W | $417,000 | |
| Closed | Hostrop Frederick W | $417,000 |
Source: Public Records
Tax History
| Year | Tax Paid | Tax Assessment Tax Assessment Total Assessment is a certain percentage of the fair market value that is determined by local assessors to be the total taxable value of land and additions on the property. | Land | Improvement |
|---|---|---|---|---|
| 2025 | $12,575 | $1,389,500 | $961,600 | $427,900 |
| 2024 | $12,939 | $1,444,100 | $1,057,700 | $386,400 |
| 2023 | $11,775 | $1,177,500 | $836,600 | $340,900 |
| 2022 | $11,430 | $1,086,500 | $750,000 | $336,500 |
| 2021 | $10,339 | $992,200 | $673,100 | $319,100 |
| 2020 | $10,562 | $1,016,600 | $721,200 | $295,400 |
| 2019 | $9,885 | $920,400 | $625,000 | $295,400 |
| 2018 | $9,379 | $851,100 | $576,900 | $274,200 |
| 2017 | $9,314 | $846,000 | $567,300 | $278,700 |
| 2016 | $7,858 | $707,900 | $500,000 | $207,900 |
| 2015 | $8,135 | $734,200 | $528,900 | $205,300 |
| 2014 | $8,636 | $778,700 | $576,900 | $201,800 |
Source: Public Records
Map
Nearby Homes
- 69 Naugus Ave
- 69 Kenneth Rd
- 23 Whittier Rd
- 4 Broadmere Way
- 16 Liberty Rd
- 155 Green St Unit 4
- 3 Beacon Heights Ln
- 55 Stony Brook Rd
- 5 Ramsay Rd
- 4 Winter Island Rd
- 5 Winter Island Rd
- 78 Garfield St
- 13 Elm St Unit 13A
- 197A W Shore Dr Unit A
- 96 Derby St Unit 1
- 31 Mugford St
- 189 W Shore Dr
- 20 Mechanic Square Unit 2
- 20 Mechanic Square Unit 3
- 149 Elm St
- 23 Sparhawk Terrace
- 80 Naugus Ave
- 84 Naugus Ave
- 76 Naugus Ave
- 21 Sparhawk Terrace
- 72 Naugus Ave
- 28 Naugus Ave
- 88 Naugus Ave
- 19 Sparhawk Terrace
- 31 Sparhawk Terrace
- 29 Sparhawk Terrace
- 70 Naugus Ave
- 81 Naugus Ave
- 79 Naugus Ave
- 75 Naugus Ave
- 18 Sparhawk Terrace
- 90 Naugus Ave
- 83 Naugus Ave
- 17 Sparhawk Terrace
- 6 Sparhawk Terrace
Your Personal Tour Guide
Ask me questions while you tour the home.