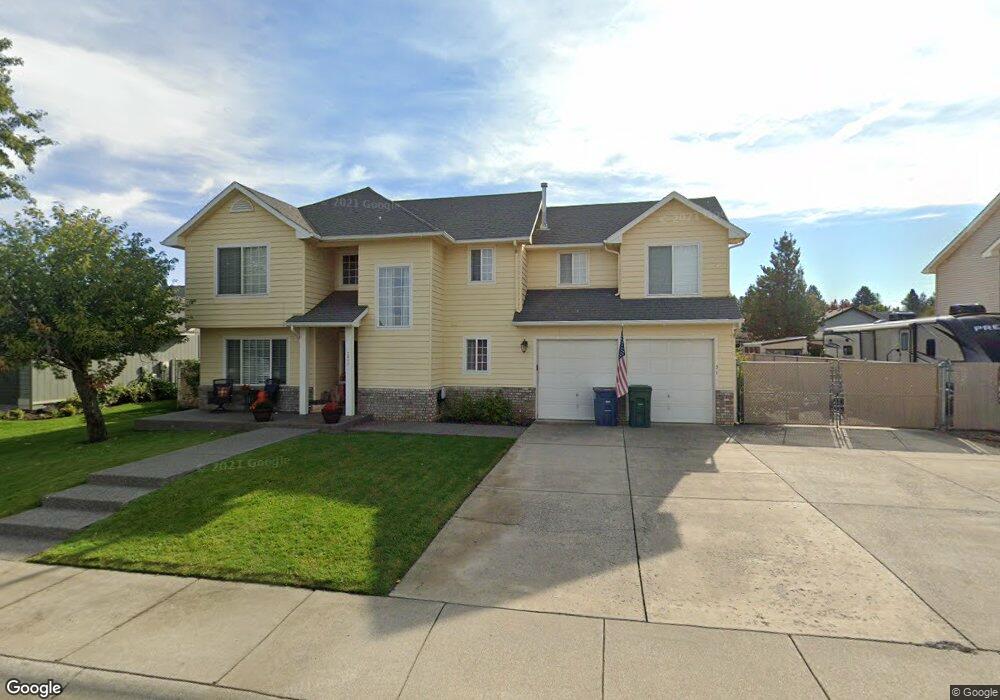
2512 N Rawhide Ridge Rd Post Falls, ID 83854
Central Post Falls NeighborhoodEstimated Value: $500,635 - $523,000
3
Beds
2
Baths
2,110
Sq Ft
$242/Sq Ft
Est. Value
About This Home
This home is located at 2512 N Rawhide Ridge Rd, Post Falls, ID 83854 and is currently estimated at $510,409, approximately $241 per square foot. 2512 N Rawhide Ridge Rd is a home located in Kootenai County with nearby schools including Mullan Trail Elementary School, River City Middle School, and Post Falls High School.
Ownership History
Date
Name
Owned For
Owner Type
Purchase Details
Closed on
Dec 10, 2021
Sold by
Steckman Jonathan D
Bought by
Steckman Cristine
Current Estimated Value
Home Financials for this Owner
Home Financials are based on the most recent Mortgage that was taken out on this home.
Original Mortgage
$234,000
Outstanding Balance
$212,480
Interest Rate
3.09%
Mortgage Type
New Conventional
Estimated Equity
$297,929
Purchase Details
Closed on
Dec 1, 2016
Sold by
Steckman Jonathan D
Bought by
Steckman Cristine
Home Financials for this Owner
Home Financials are based on the most recent Mortgage that was taken out on this home.
Original Mortgage
$218,250
Interest Rate
3.52%
Mortgage Type
New Conventional
Purchase Details
Closed on
Nov 30, 2016
Sold by
Babbitt Ralph M and Babbitt Rhonda G
Bought by
Steckman Cristine
Home Financials for this Owner
Home Financials are based on the most recent Mortgage that was taken out on this home.
Original Mortgage
$218,250
Interest Rate
3.52%
Mortgage Type
New Conventional
Create a Home Valuation Report for This Property
The Home Valuation Report is an in-depth analysis detailing your home's value as well as a comparison with similar homes in the area
Home Values in the Area
Average Home Value in this Area
Purchase History
| Date | Buyer | Sale Price | Title Company |
|---|---|---|---|
| Steckman Cristine | -- | Titleone Boise | |
| Steckman Cristine | -- | Title One | |
| Steckman Cristine | -- | First American Title Kootena | |
| Steckman Cristine | -- | First American Title Kootena |
Source: Public Records
Mortgage History
| Date | Status | Borrower | Loan Amount |
|---|---|---|---|
| Open | Steckman Cristine | $234,000 | |
| Closed | Steckman Cristine | $234,000 | |
| Previous Owner | Steckman Cristine | $218,250 |
Source: Public Records
Tax History
| Year | Tax Paid | Tax Assessment Tax Assessment Total Assessment is a certain percentage of the fair market value that is determined by local assessors to be the total taxable value of land and additions on the property. | Land | Improvement |
|---|---|---|---|---|
| 2025 | $2,079 | $512,690 | $198,000 | $314,690 |
| 2024 | $1,793 | $445,570 | $132,000 | $313,570 |
| 2023 | $1,793 | $469,163 | $165,000 | $304,163 |
| 2022 | $2,439 | $519,334 | $165,000 | $354,334 |
| 2021 | $2,218 | $342,650 | $110,000 | $232,650 |
| 2020 | $2,141 | $285,790 | $80,000 | $205,790 |
| 2019 | $2,020 | $257,820 | $85,000 | $172,820 |
| 2018 | $1,876 | $232,510 | $75,000 | $157,510 |
| 2017 | $1,717 | $210,650 | $55,000 | $155,650 |
| 2016 | $2,975 | $186,350 | $50,000 | $136,350 |
| 2015 | $2,839 | $174,810 | $44,000 | $130,810 |
| 2013 | $2,732 | $155,580 | $32,000 | $123,580 |
Source: Public Records
Map
Nearby Homes
- 3262 Woodford
- 500 W 22nd Ave
- 368 W Tennessee Ave
- 3373 N Coleman St
- 2578 N Bradley Ct
- 2491 N Bradley Dr
- 296 W Tennessee Ave
- 2107 N Walnut St
- 2225 N Methow Ct
- 276 W Blanton Ave
- 2531 N Titleist Way
- 109 W Tennessee Ave
- 3351 N Blaze Loop
- 2430 N Titleist Way
- 3596 Blaze Loop
- 3679 N Blaze Loop
- 3648 N Blaze Loop
- 2441 N Henry St
- 849 W Ashworth Ln
- 926 W Cordgrass Ave
- 3520 Railroad St
- 2514 N Rawhide Ridge Rd
- 2510 N Rawhide Ridge Rd
- 619 W Lariat Ct
- 608 W Colt Ln
- 2511 N Rawhide Ridge Rd
- 617 W Lariat Ct
- 606 W Colt Ln
- 706 W Brahma Ct
- 702 W Cavalry Ln
- 2610 Rawhide
- 2610 Rawhide Ridge Rd
- 2610 N Rawhide Ridge Rd
- 0 Rawhide Ridge Rd
- 703 Cavalry Ln
- 618 W Lariat Ct
- 703 W Cavalry Ln
- 604 W Colt Ln
- 2615 N Rawhide Ridge Rd
- 708 W Brahma Ct
Your Personal Tour Guide
Ask me questions while you tour the home.