Estimated Value: $231,000 - $235,000
4
Beds
2
Baths
928
Sq Ft
$250/Sq Ft
Est. Value
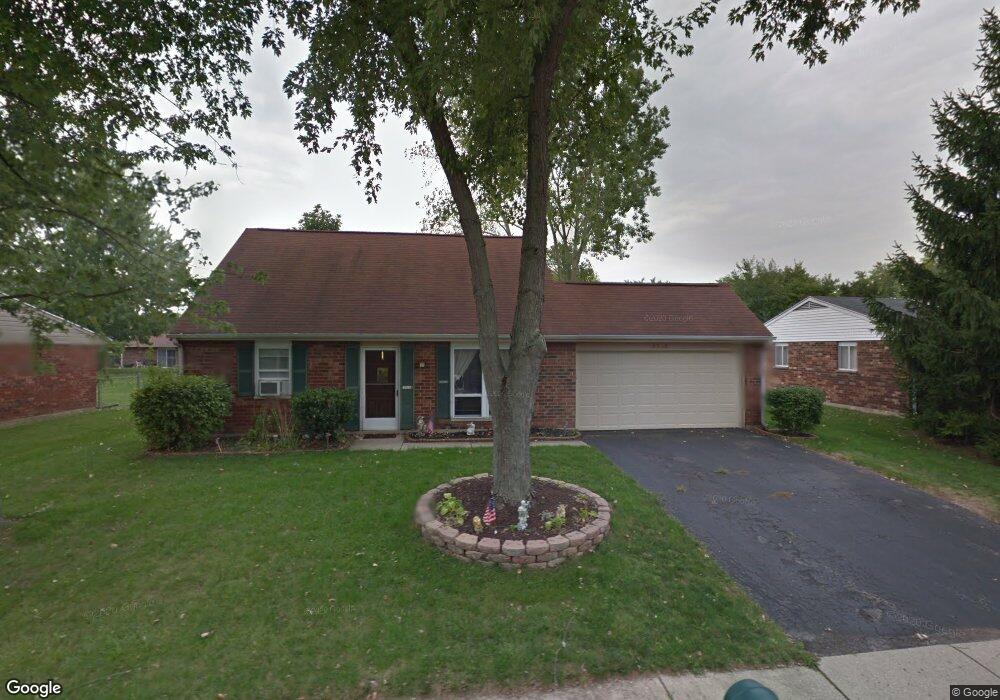
About This Home
This home is located at 2516 Inverness Ct, Troy, OH 45373 and is currently estimated at $232,036, approximately $250 per square foot. 2516 Inverness Ct is a home located in Miami County with nearby schools including Hook Elementary School, Troy Junior High School, and Van Cleve Elementary School.
Ownership History
Date
Name
Owned For
Owner Type
Purchase Details
Closed on
Feb 22, 2011
Sold by
Bazaar John J and Bazaar Kathryn T
Bought by
Ferris Judith K
Current Estimated Value
Home Financials for this Owner
Home Financials are based on the most recent Mortgage that was taken out on this home.
Original Mortgage
$79,920
Outstanding Balance
$53,756
Interest Rate
4.81%
Mortgage Type
New Conventional
Estimated Equity
$178,280
Purchase Details
Closed on
Jun 7, 2000
Sold by
Lehman Randy L and Lehman Cynthia L
Bought by
Bazaar John J and Bazaar Kathryn T
Home Financials for this Owner
Home Financials are based on the most recent Mortgage that was taken out on this home.
Original Mortgage
$92,055
Interest Rate
8.14%
Mortgage Type
New Conventional
Purchase Details
Closed on
Jun 2, 1989
Bought by
Lehman Randy L
Create a Home Valuation Report for This Property
The Home Valuation Report is an in-depth analysis detailing your home's value as well as a comparison with similar homes in the area
Home Values in the Area
Average Home Value in this Area
Purchase History
We collect this data history from publicly available records. To have your information removed, we recommend requesting removal directly through your county’s website.
| Date | Buyer | Sale Price | Title Company |
|---|---|---|---|
| Ferris Judith K | $99,900 | -- | |
| Bazaar John J | $96,900 | -- | |
| Lehman Randy L | $58,200 | -- |
Source: Public Records
Mortgage History
We collect this data history from publicly available records. To have your information removed, we recommend requesting removal directly through your county’s website.
| Date | Status | Borrower | Loan Amount |
|---|---|---|---|
| Open | Bazaar John J | $79,920 | |
| Previous Owner | Bazaar John J | $92,055 |
Source: Public Records
Tax History
| Year | Tax Paid | Tax Assessment Tax Assessment Total Assessment is a certain percentage of the fair market value that is determined by local assessors to be the total taxable value of land and additions on the property. | Land | Improvement |
|---|---|---|---|---|
| 2025 | $1,627 | $63,840 | $9,660 | $54,180 |
| 2024 | $1,627 | $53,940 | $11,270 | $42,670 |
| 2023 | $1,793 | $53,940 | $11,270 | $42,670 |
| 2022 | $709 | $53,940 | $11,270 | $42,670 |
| 2021 | $984 | $38,540 | $8,050 | $30,490 |
| 2020 | $986 | $38,540 | $8,050 | $30,490 |
| 2019 | $995 | $38,540 | $8,050 | $30,490 |
| 2018 | $781 | $31,260 | $8,370 | $22,890 |
| 2017 | $789 | $31,260 | $8,370 | $22,890 |
| 2016 | $777 | $31,260 | $8,370 | $22,890 |
| 2015 | $768 | $30,070 | $8,050 | $22,020 |
| 2014 | $768 | $30,070 | $8,050 | $22,020 |
| 2013 | $773 | $30,070 | $8,050 | $22,020 |
Source: Public Records
Map
Nearby Homes
- 2508 Foxchase Ct W
- 2483 Foxchase Ct E
- 2792 Executive Dr
- 2407 Waterford Dr
- 2765 Liette Dr
- 2520 Saint Andrews Dr
- 191 Chapel Dr E
- 243 Chapel Ct
- 522 Northpoint Ct
- 622 Willow Point Ct
- 2455 Lupine Ct
- 653 Willow Point Ct
- 661 Willow Point Ct
- 2548 Winfield Ct
- 2961 Parkwood Dr
- 690 Rosecrest Dr
- 2365 Murphy Ln W
- 835 Cobblestone Dr
- 911 Branford Rd
- 1536 Brook Park Dr
- 2518 Inverness Ct
- 2514 Inverness Ct
- 2515 Thornhill Dr
- 2517 Thornhill Dr
- 2520 Inverness Ct
- 2512 Inverness Ct
- 2513 Thornhill Dr
- 2519 Thornhill Dr
- 2513 Inverness Ct
- 2511 Inverness Ct
- 2511 Thornhill Dr
- 2515 Inverness Ct
- 2521 Thornhill Dr
- 2509 Inverness Ct
- 2510 Inverness Ct
- 2522 Inverness Ct
- 2509 Thornhill Dr
- 2523 Thornhill Dr
- 2507 Inverness Ct
- 2517 Inverness Ct
Your Personal Tour Guide
Ask me questions while you tour the home.