252 4th St Providence, RI 02906
Blackstone NeighborhoodEstimated Value: $586,000 - $989,000
About This Home
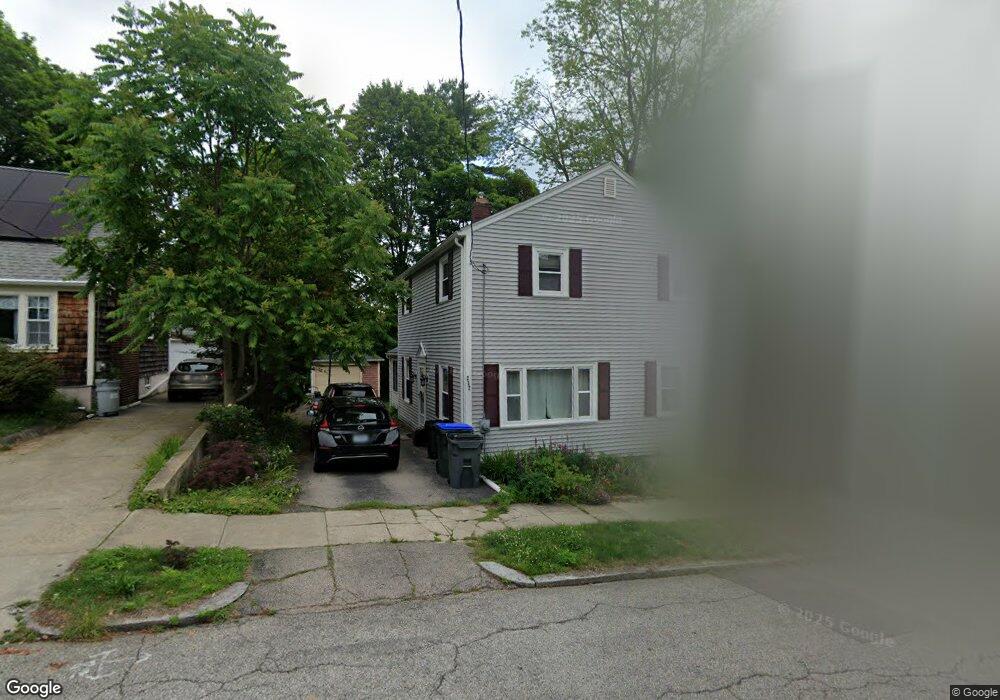
This home is located at 252 4th St, Providence, RI 02906 and is currently estimated at $813,089, approximately $454 per square foot. 252 4th St is a home located in Providence County with nearby schools including Jewish Community Day School Of Rhode Island, Montessori Childrens House, and Lincoln School.
Ownership History
We collect this data history from publicly available records. To have your information removed, we recommend requesting removal directly through your county’s website.
Purchase Details
Purchase Details
Purchase Details
Purchase Details
Home Values in the Area
Average Home Value in this Area
Purchase History
We collect this data history from publicly available records. To have your information removed, we recommend requesting removal directly through your county’s website.
| Date | Buyer | Sale Price | Title Company |
|---|---|---|---|
| $299,000 | -- | ||
| $178,000 | -- | ||
| $142,000 | -- | ||
| $137,000 | -- |
Mortgage History
We collect this data history from publicly available records. To have your information removed, we recommend requesting removal directly through your county’s website.
| Date | Status | Borrower | Loan Amount |
|---|---|---|---|
| Open | $270,000 | ||
| Closed | $14,400 |
Tax History
We collect this data history from publicly available records. To have your information removed, we recommend requesting removal directly through your county’s website.
| Year | Tax Paid | Tax Assessment Tax Assessment Total Assessment is a certain percentage of the fair market value that is determined by local assessors to be the total taxable value of land and additions on the property. | Land | Improvement |
|---|---|---|---|---|
| 2025 | $5,389 | $641,600 | $371,500 | $270,100 |
| 2024 | $9,502 | $517,800 | $250,400 | $267,400 |
| 2023 | $9,502 | $517,800 | $250,400 | $267,400 |
| 2022 | $9,217 | $517,800 | $250,400 | $267,400 |
| 2021 | $10,242 | $417,000 | $200,200 | $216,800 |
| 2020 | $9,969 | $405,900 | $200,200 | $205,700 |
| 2019 | $9,969 | $405,900 | $200,200 | $205,700 |
| 2018 | $10,981 | $343,600 | $173,300 | $170,300 |
| 2017 | $10,981 | $343,600 | $173,300 | $170,300 |
| 2016 | $10,560 | $330,400 | $173,300 | $157,100 |
| 2015 | $10,334 | $312,200 | $161,700 | $150,500 |
| 2014 | $10,537 | $312,200 | $161,700 | $150,500 |
| 2013 | $10,537 | $312,200 | $161,700 | $150,500 |
Map
- 217 4th St
- 229 6th St
- 199 5th St
- 843 Hope St Unit 3
- 771 Hope St
- 102 Overhill Rd
- 47 Lauriston St
- 756 Hope St
- 62 Harwich Rd
- 215 Rochambeau Ave
- 206 Rochambeau Ave Unit 1
- 30 Langham Rd
- 20 Summit Ave
- 170 4th St
- 170 4th St Unit 3
- 377 Cole Ave
- 14 Maxcy Dr
- 22 Taft Ave Unit 1
- 66 Edgehill Rd
- 310 Blackstone Blvd
- 56 Lorimer Ave Unit 58
- 54 Lorimer Ave
- 235 & 239 Fourth St
- 245 4th St
- 254 4th St
- 57 Lorimer Ave
- 246 4th St
- 49 Lorimer Ave
- 128 Lauriston St
- 124 Lauriston St
- 260 4th St Unit 2
- 260 4th St Unit 1
- 47 Lorimer Ave
- 120 Lauriston St
- 242 4th St
- 264 4th St Unit 2
- 264 4th St
- 235 4th St
- 39 Lorimer Ave
- 114 Lauriston St
Ask me questions while you tour the home.