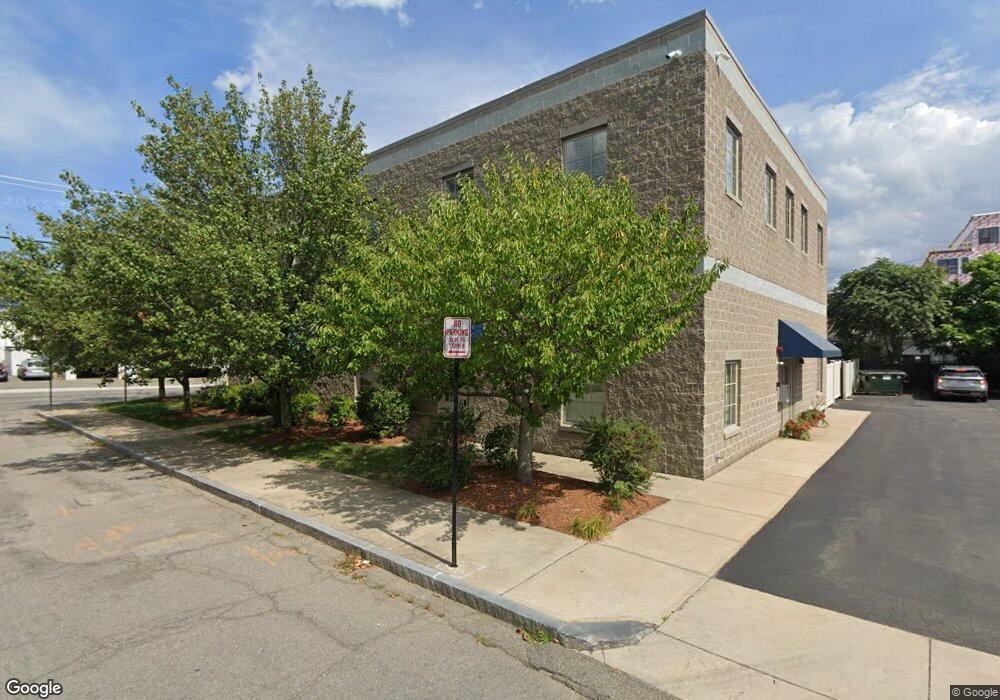
253 Centre St Quincy, MA 02169
South Quincy NeighborhoodEstimated Value: $2,017,198
Studio
2
Baths
6,900
Sq Ft
$292/Sq Ft
Est. Value
About This Home
This home is located at 253 Centre St, Quincy, MA 02169 and is currently estimated at $2,017,198, approximately $292 per square foot. 253 Centre St is a home located in Norfolk County with nearby schools including South West Middle School, Lincoln-Hancock Community School, and Quincy High School.
Ownership History
Date
Name
Owned For
Owner Type
Purchase Details
Closed on
Dec 7, 2020
Sold by
G & R Rt
Bought by
Falconi Realty Co Llc
Current Estimated Value
Purchase Details
Closed on
Sep 1, 2005
Sold by
Branch Street Rt and Foley Robert R
Bought by
G & R Rt and Morel Dennis P
Purchase Details
Closed on
Jan 9, 2004
Sold by
Marini Robert S
Bought by
Branch Street Rt and Foley Robert R
Create a Home Valuation Report for This Property
The Home Valuation Report is an in-depth analysis detailing your home's value as well as a comparison with similar homes in the area
Home Values in the Area
Average Home Value in this Area
Purchase History
| Date | Buyer | Sale Price | Title Company |
|---|---|---|---|
| Falconi Realty Co Llc | $1,540,000 | None Available | |
| G & R Rt | $400,000 | -- | |
| Branch Street Rt | $250,000 | -- |
Source: Public Records
Tax History
| Year | Tax Paid | Tax Assessment Tax Assessment Total Assessment is a certain percentage of the fair market value that is determined by local assessors to be the total taxable value of land and additions on the property. | Land | Improvement |
|---|---|---|---|---|
| 2025 | $34,998 | $1,521,000 | $249,100 | $1,271,900 |
| 2024 | $33,720 | $1,502,000 | $246,600 | $1,255,400 |
| 2023 | $32,389 | $1,460,300 | $244,200 | $1,216,100 |
| 2022 | $33,447 | $1,401,800 | $232,600 | $1,169,200 |
| 2021 | $19,851 | $819,600 | $230,500 | $589,100 |
| 2020 | $19,882 | $800,400 | $228,200 | $572,200 |
| 2019 | $19,761 | $784,800 | $225,900 | $558,900 |
| 2018 | $20,172 | $746,000 | $223,600 | $522,400 |
| 2017 | $19,379 | $675,000 | $217,200 | $457,800 |
| 2016 | $17,895 | $609,300 | $217,200 | $392,100 |
| 2015 | $18,171 | $600,500 | $217,200 | $383,300 |
| 2014 | $17,795 | $569,800 | $217,200 | $352,600 |
Source: Public Records
Map
Nearby Homes
- 51 Branch St Unit 3
- 87 Village Dr
- 21 Totman St Unit 205
- 21 Totman St Unit 409
- 21 Totman St Unit 203
- 21 Totman St Unit 403
- 21 Totman St Unit 301
- 21 Totman St Unit 208
- 21 Totman St Unit PH-401
- 21 Totman St Unit 204
- 79 Gilbert St
- 132 Centre St
- 9 Westford St
- 56 Penn St Unit 4
- 91 Garfield St
- 21 Arthur St
- 84 West St Unit 1
- 156 West St
- 99 Verchild St
- 8 Jackson St Unit B1
- 243 Centre St
- 11 Branch St
- 9 Vernon St
- 11 Vernon St
- 20A Branch St
- 20 Branch St
- 241 Centre St
- 254 Centre St
- 17 Branch St Unit 19
- 19 Branch St
- 120 Brooks Ave
- 24 Branch St
- 24 Branch St Unit 2
- 26 Branch St Unit 1
- 12 Albertina St
- 233 Centre St
- 114 Brooks Ave
- 16 Albertina St
- 16 Albertina St Unit 16
- 3 Caledonia Ave
Your Personal Tour Guide
Ask me questions while you tour the home.