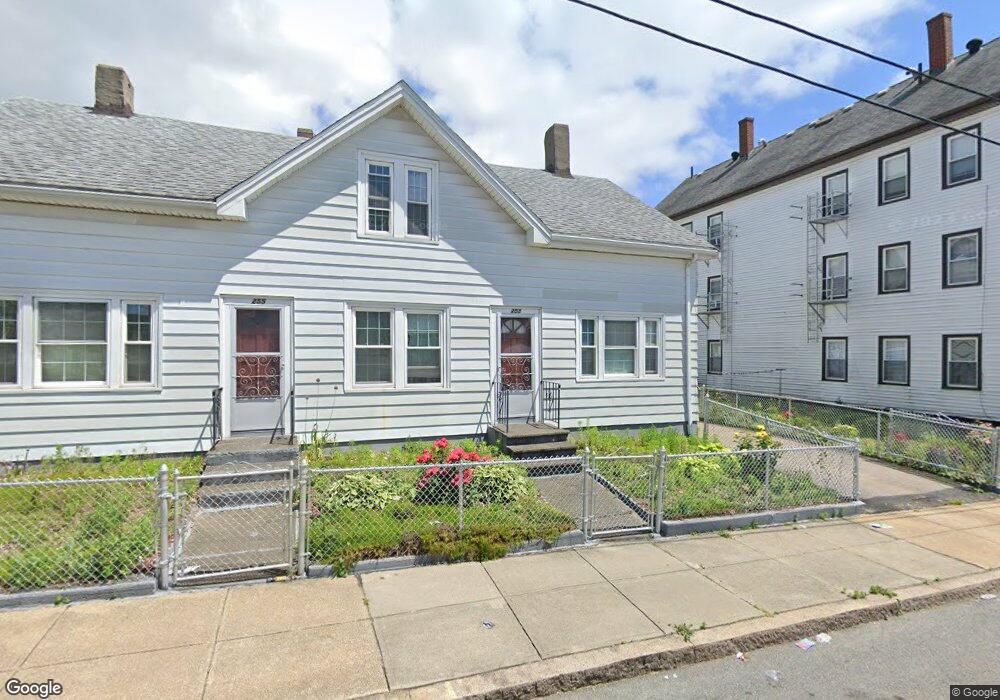
253 Orange St Fall River, MA 02720
Oak Grove Village NeighborhoodEstimated Value: $409,110 - $528,000
About This Home
This home is located at 253 Orange St, Fall River, MA 02720 and is currently estimated at $468,528, approximately $285 per square foot. 253 Orange St is a home located in Bristol County with nearby schools including Mary Fonseca Elementary School, Morton Middle School, and B M C Durfee High School.
Ownership History
We collect this data history from publicly available records. To have your information removed, we recommend requesting removal directly through your county’s website.
Purchase Details
Purchase Details
Home Values in the Area
Average Home Value in this Area
Purchase History
We collect this data history from publicly available records. To have your information removed, we recommend requesting removal directly through your county’s website.
| Date | Buyer | Sale Price | Title Company |
|---|---|---|---|
| -- | None Available | ||
| -- | None Available | ||
| -- | None Available | ||
| -- | None Available | ||
| -- | None Available | ||
| -- | None Available |
Tax History
We collect this data history from publicly available records. To have your information removed, we recommend requesting removal directly through your county’s website.
| Year | Tax Paid | Tax Assessment Tax Assessment Total Assessment is a certain percentage of the fair market value that is determined by local assessors to be the total taxable value of land and additions on the property. | Land | Improvement |
|---|---|---|---|---|
| 2025 | $3,846 | $335,900 | $123,700 | $212,200 |
| 2024 | $3,544 | $308,400 | $119,000 | $189,400 |
| 2023 | $3,200 | $260,800 | $102,000 | $158,800 |
| 2022 | $2,929 | $232,100 | $92,700 | $139,400 |
| 2021 | $2,720 | $196,700 | $85,800 | $110,900 |
| 2020 | $2,461 | $170,300 | $82,100 | $88,200 |
| 2019 | $2,328 | $159,700 | $78,200 | $81,500 |
| 2018 | $2,211 | $151,200 | $76,800 | $74,400 |
| 2017 | $2,076 | $148,300 | $78,300 | $70,000 |
| 2016 | $2,042 | $149,800 | $81,600 | $68,200 |
| 2015 | $1,920 | $146,800 | $78,600 | $68,200 |
| 2014 | $1,979 | $157,300 | $82,700 | $74,600 |
Map
- 1017 Pine St
- 119-121 Tremont St
- 90 Tremont St
- 30 Orange St
- 956 Maple St
- 37 Shawmut St
- 609 Cherry St
- 511 Bank St
- 615 Robeson St
- 120 15th St Unit 4
- 540 Cherry St Unit 1
- 630 Maple St
- 464 Bank St Unit 10
- 434 Linden St Unit 2
- 434 Linden St Unit 4
- 501 Pine St
- 51 Summerfield St
- 47 Summerfield St
- 89 Oak St
- 104 Oak St
- 235 Orange St
- 935 Cherry St
- 935 Cherry St Unit 2
- 275 Orange St
- 227 Orange St
- 227 Orange St Unit 1
- 238 Orange St
- 896 Cherry St
- 896 Cherry St Unit 1
- 928 Cherry St
- 887 Cherry St
- 246 Davis St
- 219 Orange St Unit 2
- 219 Orange St
- 226 Davis St
- 274 Davis St
- 282 Orange St
- 282 Orange St Unit 2
- 282 Orange St Unit 1
- 886 Cherry St
Ask me questions while you tour the home.