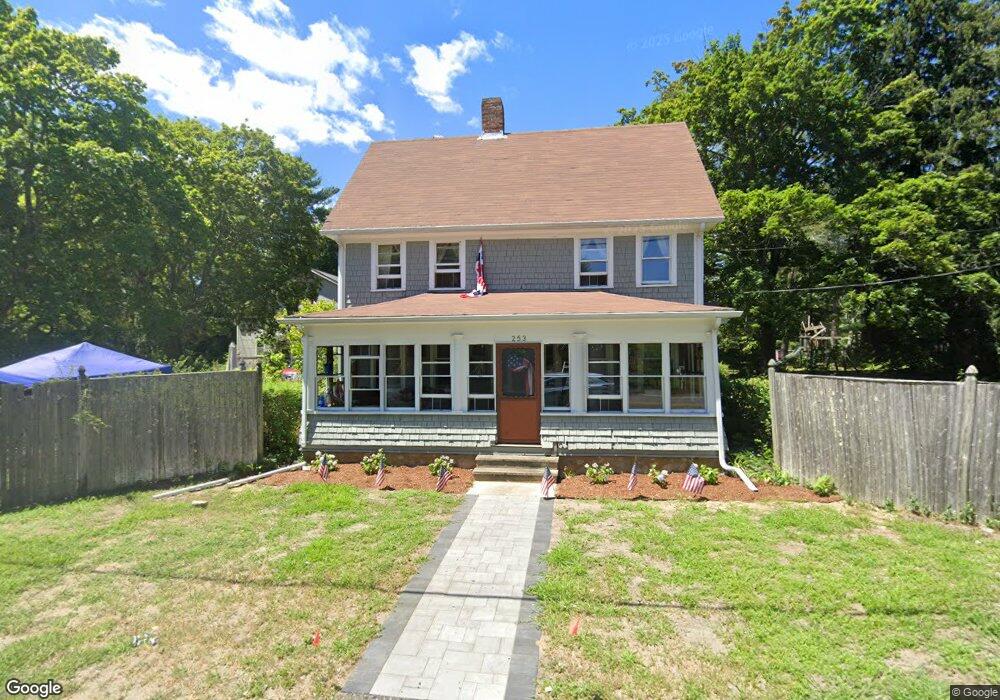
253 Tremont St Carver, MA 02330
Estimated Value: $622,906 - $812,000
About This Home
This home is located at 253 Tremont St, Carver, MA 02330 and is currently estimated at $696,477, approximately $403 per square foot. 253 Tremont St is a home located in Plymouth County with nearby schools including Carver Elementary School and Carver Middle/High School.
Ownership History
We collect this data history from publicly available records. To have your information removed, we recommend requesting removal directly through your county’s website.
Purchase Details
Home Financials for this Owner
Home Financials are based on the most recent Mortgage that was taken out on this home.Home Values in the Area
Average Home Value in this Area
Purchase History
We collect this data history from publicly available records. To have your information removed, we recommend requesting removal directly through your county’s website.
| Date | Buyer | Sale Price | Title Company |
|---|---|---|---|
| $76,500 | -- |
Mortgage History
We collect this data history from publicly available records. To have your information removed, we recommend requesting removal directly through your county’s website.
| Date | Status | Borrower | Loan Amount |
|---|---|---|---|
| Closed | $1,500,000 | ||
| Closed | $162,000 |
Tax History
We collect this data history from publicly available records. To have your information removed, we recommend requesting removal directly through your county’s website.
| Year | Tax Paid | Tax Assessment Tax Assessment Total Assessment is a certain percentage of the fair market value that is determined by local assessors to be the total taxable value of land and additions on the property. | Land | Improvement |
|---|---|---|---|---|
| 2025 | $8,100 | $584,000 | $140,400 | $443,600 |
| 2024 | $7,789 | $549,700 | $137,700 | $412,000 |
| 2023 | $7,558 | $518,000 | $137,700 | $380,300 |
| 2022 | $7,332 | $458,800 | $124,200 | $334,600 |
| 2021 | $638 | $423,700 | $110,900 | $312,800 |
| 2020 | $4,760 | $403,900 | $103,600 | $300,300 |
| 2019 | $631 | $394,900 | $100,600 | $294,300 |
| 2018 | $6,639 | $376,600 | $100,600 | $276,000 |
| 2017 | $677 | $356,900 | $96,800 | $260,100 |
| 2016 | $5,995 | $352,000 | $87,400 | $264,600 |
| 2015 | $5,891 | $346,300 | $87,400 | $258,900 |
| 2014 | $5,804 | $341,200 | $104,300 | $236,900 |
Map
- 7 Lakeview St
- 16 Indian St
- 33 Wareham St Unit 11
- 16 S Main St
- 41 Pipers Way
- 71 S Main St
- 29 Presidents Way
- 178 Tremont St
- 5 Marks Way
- 5 Cheryl Ln
- 36 Cheryl Ln
- 28 S Main St
- 5 Ohana Way
- 268 Meadow St
- 2232 Cranberry Hwy Unit B
- 2230 Cranberry Hwy Unit A
- 7 Bisbee Dr
- 38 Popes Point Rd
- 17 Pond Edge Trail
- 9 King Dr
Ask me questions while you tour the home.