254 Salem St Lawrence, MA 01843
South West NeighborhoodEstimated Value: $467,958 - $630,000
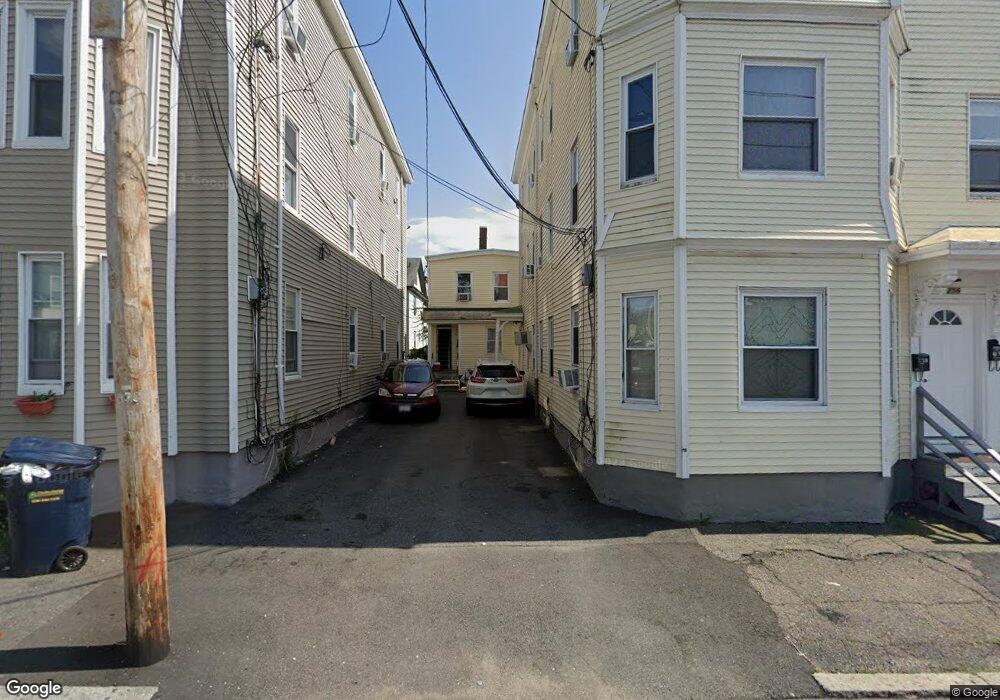
About This Home
This home is located at 254 Salem St, Lawrence, MA 01843 and is currently estimated at $539,240, approximately $393 per square foot. 254 Salem St is a home located in Essex County with nearby schools including John Breen School, Emily G. Wetherbee School (K-8), and School For Exceptional Studies.
Ownership History
We collect this data history from publicly available records. To have your information removed, we recommend requesting removal directly through your county’s website.
Purchase Details
Purchase Details
Home Values in the Area
Average Home Value in this Area
Purchase History
We collect this data history from publicly available records. To have your information removed, we recommend requesting removal directly through your county’s website.
| Date | Buyer | Sale Price | Title Company |
|---|---|---|---|
| $1,795,000 | None Available | ||
| $177,000 | -- | ||
| $45,000 | -- |
Mortgage History
We collect this data history from publicly available records. To have your information removed, we recommend requesting removal directly through your county’s website.
| Date | Status | Borrower | Loan Amount |
|---|---|---|---|
| Closed | $937,500 | ||
| Previous Owner | $49,000 |
Tax History
We collect this data history from publicly available records. To have your information removed, we recommend requesting removal directly through your county’s website.
| Year | Tax Paid | Tax Assessment Tax Assessment Total Assessment is a certain percentage of the fair market value that is determined by local assessors to be the total taxable value of land and additions on the property. | Land | Improvement |
|---|---|---|---|---|
| 2025 | $3,182 | $361,600 | $75,800 | $285,800 |
| 2024 | $3,132 | $338,600 | $82,100 | $256,500 |
| 2023 | $3,050 | $300,200 | $76,100 | $224,100 |
| 2022 | $2,852 | $249,300 | $69,000 | $180,300 |
| 2021 | $2,799 | $228,100 | $69,000 | $159,100 |
| 2020 | $2,690 | $216,400 | $65,400 | $151,000 |
| 2019 | $2,681 | $196,000 | $54,400 | $141,600 |
| 2018 | $2,463 | $172,000 | $51,500 | $120,500 |
| 2017 | $2,295 | $149,600 | $48,600 | $101,000 |
| 2016 | $2,224 | $143,400 | $40,000 | $103,400 |
| 2015 | $2,180 | $144,200 | $40,000 | $104,200 |
Map
- 301 Salem St
- 86 S Broadway
- 82 S Broadway
- 30 S Broadway
- 14 Tyler St Unit 1
- 18-20 Everett St
- 136-138 Sanborn St
- 66-68 Water St
- 33 Garfield St
- 134-136 Boxford St
- 263-265 Water St
- 267-269 Water St
- 18 Hancock St
- 312 Water St Unit 23
- 159 S Union St
- 152-158 S Union St
- 191 Farnham St
- 10 Kempton Ct
- 2 Andover Terrace
- 350 S Broadway
- 256 Salem St
- 246 Salem St Unit 258
- 246-258 Salem St
- 260 Salem St
- 240 Salem St Unit 244
- 252 Salem St Unit 1st floor
- 250 Salem St
- 250 Salem St Unit 3rd floor
- 11 1/2 Kingston St
- 266 Salem St
- 238 Salem St
- 255 Salem St
- 247 Salem St
- 261 Salem St
- 241-243 Salem St
- 241 Salem St Unit 243
- 263 Salem St Unit 267
- 13 Kingston St
- 11 Kingston St
- 274 Salem St Unit 276
Ask me questions while you tour the home.