2579 N Main St Fall River, MA 02720
Western Fall River NeighborhoodEstimated Value: $412,000 - $640,000
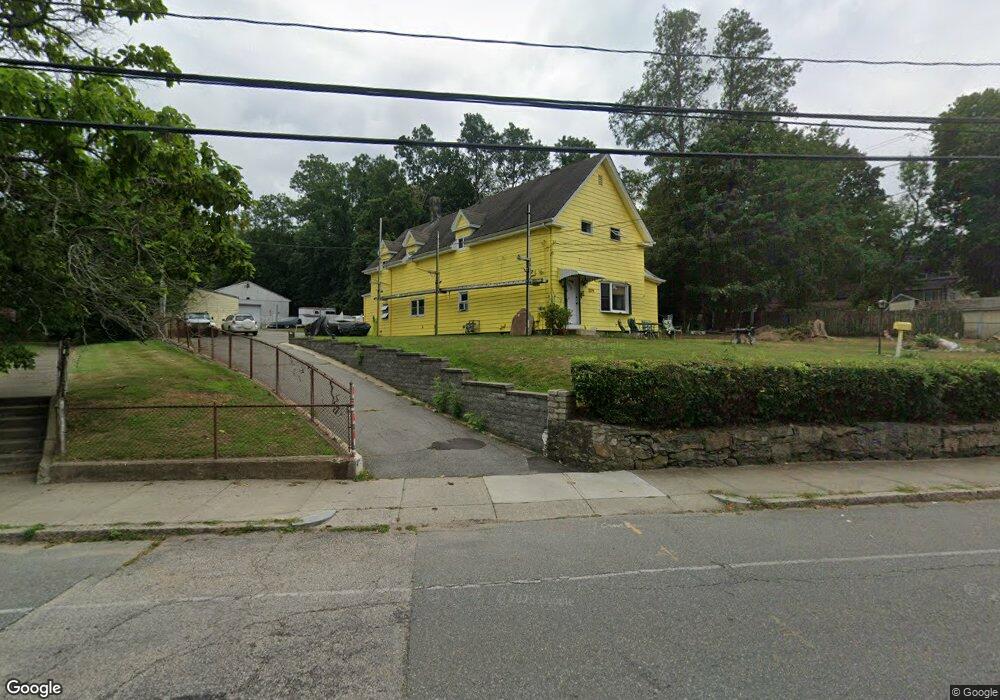
About This Home
This home is located at 2579 N Main St, Fall River, MA 02720 and is currently estimated at $528,179, approximately $263 per square foot. 2579 N Main St is a home located in Bristol County with nearby schools including North End Elementary School, Morton Middle School, and B M C Durfee High School.
Ownership History
We collect this data history from publicly available records. To have your information removed, we recommend requesting removal directly through your county’s website.
Purchase Details
Purchase Details
Purchase Details
Home Financials for this Owner
Home Financials are based on the most recent Mortgage that was taken out on this home.Purchase Details
Home Financials for this Owner
Home Financials are based on the most recent Mortgage that was taken out on this home.Home Values in the Area
Average Home Value in this Area
Purchase History
We collect this data history from publicly available records. To have your information removed, we recommend requesting removal directly through your county’s website.
| Date | Buyer | Sale Price | Title Company |
|---|---|---|---|
| -- | -- | ||
| -- | -- | ||
| $75,000 | -- | ||
| $131,500 | -- |
Mortgage History
We collect this data history from publicly available records. To have your information removed, we recommend requesting removal directly through your county’s website.
| Date | Status | Borrower | Loan Amount |
|---|---|---|---|
| Previous Owner | $204,854 | ||
| Previous Owner | $60,000 | ||
| Previous Owner | $230,000 | ||
| Previous Owner | $217,000 | ||
| Previous Owner | $197,100 | ||
| Previous Owner | $44,400 | ||
| Previous Owner | $15,695 | ||
| Previous Owner | $105,000 |
Tax History
We collect this data history from publicly available records. To have your information removed, we recommend requesting removal directly through your county’s website.
| Year | Tax Paid | Tax Assessment Tax Assessment Total Assessment is a certain percentage of the fair market value that is determined by local assessors to be the total taxable value of land and additions on the property. | Land | Improvement |
|---|---|---|---|---|
| 2025 | $4,306 | $376,100 | $146,200 | $229,900 |
| 2024 | $3,987 | $347,000 | $140,700 | $206,300 |
| 2023 | $3,672 | $299,300 | $120,600 | $178,700 |
| 2022 | $3,160 | $267,800 | $109,600 | $158,200 |
| 2021 | $3,160 | $228,500 | $101,500 | $127,000 |
| 2020 | $2,884 | $199,600 | $97,100 | $102,500 |
| 2019 | $2,740 | $187,900 | $92,500 | $95,400 |
| 2018 | $2,613 | $178,700 | $90,800 | $87,900 |
| 2017 | $2,461 | $175,800 | $92,600 | $83,200 |
| 2016 | $2,422 | $177,700 | $96,400 | $81,300 |
| 2015 | $2,279 | $174,200 | $92,900 | $81,300 |
| 2014 | $2,339 | $185,900 | $97,800 | $88,100 |
Map
- 232 Mount Pleasant St
- 1810 Highland Ave Unit 4A
- 409 Crescent St
- 318 Crescent St Unit A
- 1984 Robeson St
- 22 Montgomery St
- 200 Highcrest Rd
- 200 Crescent St
- 45 Archer St
- 88 Jones St
- 564 Montgomery St
- 604 Woodlawn St
- 1800 Robeson St
- 12 Goddard St
- 414 Archer St
- 341 Courtney St
- 87 Stowe St
- 2118 Riverside Ave
- 50 Clark St Unit 22
- 793 Montgomery St
Ask me questions while you tour the home.